
The familiar landmarks in NCAA Division I baseball include Pete Incaviglia’s 100 career home runs, his 48-homer season and Marshall McDougall’s six-homer game. Those numbers describe three very different kinds of achievement. A useful records guide keeps their counting windows visible and explains the opportunities behind them.
Start with the right Division I record book
This guide covers selected NCAA Division I benchmarks, rather than a combined list of NCAA, NAIA and junior-college performances. Its historical starting point is the NCAA’s baseball records hub and the Division I individual-and-team PDF linked there, consulted October 20, 2026. That linked document includes final-poll sections through 2024. Treat the figures below as established records listed in that edition, not a claim that every category has been independently recertified after the 2026 season.
The distinction matters when an old search result looks authoritative. An NCAA PDF can be a sound primary source for the number printed inside it while still being an old edition. Search engines also surface school record books, which cover one program, and championship records, which cover a much smaller set of games. The logo at the top of a page cannot tell you which of those questions the table answers.
The NCAA’s introductory notes say official Division I records began with the 1957 season and that career totals include a player’s Division I years. That makes division and season information essential parts of an accurate description. A player who transferred across levels may have a larger complete college total than the number eligible for a particular Division I table.
Career, season and game records answer different questions
A career total measures sustained production over the opportunities a player actually received. A season total captures one spring’s peak. A single-game total compresses everything into one contest, where extra innings or repeated trips through the batting order can greatly affect the result. None of the three automatically identifies the best player, most difficult opponent or strongest professional prospect.
Rate records introduce another question: who qualifies? A batting-average leaderboard needs a minimum number of at-bats; a pitching-rate leaderboard needs an innings threshold. A short, brilliant sample is interesting baseball, but it should not replace a qualifying record simply because its percentage is higher. Read the eligibility line alongside the headline number.
Finally, the Men’s College World Series has its own record collection. A CWS career combines appearances in Omaha; it is not a player’s entire college career. A championship-series record is narrower still. Keeping those labels attached lets you appreciate a postseason performance without accidentally promoting it into an all-season national record. For the current season’s games, use the college baseball schedule; for historical claims, begin with the correct statistical window.
Career records reward production and staying power
The quickest way into the career tables is through four familiar categories: home runs, hits, pitching victories and pitching strikeouts. They reward different skills, and their totals carry different relationships to opportunity. The NCAA Division I record book lists the following benchmarks. The years shown belong to the Division I career entries in that source.
| Category | Record | Player and school | Years |
|---|---|---|---|
| Home runs | 100 | Pete Incaviglia, Oklahoma State | 1983–85 |
| Hits | 418 | Phil Stephenson, Wichita State | 1979–82 |
| Pitching victories | 51 | Don Heinkel, Wichita State | 1979–82 |
| Pitching strikeouts | 602 | John Powell, Auburn | 1991–94 |
Pete Incaviglia and the career home run standard
Incaviglia’s hundred is striking partly because it came in three seasons. Oklahoma State’s university history page records 100 home runs in 213 games. That is roughly one homer every 2.13 games, a calculation that makes the career total easier to picture without pretending it is a separate NCAA rate-record category.
Reaching that total demands more than one spectacular spring. A hitter must keep producing after pitchers have seen him, after opponents have adjusted their approach and through stretches when the lineup cannot count on a friendly matchup. It also requires staying on the field and receiving enough plate appearances. That combination is why a career record can feel distant even during a season full of home runs.
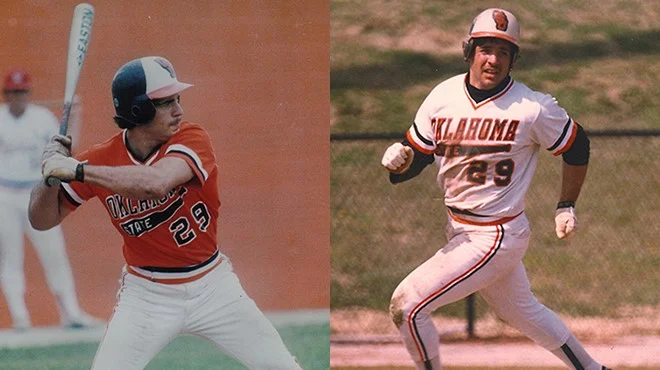
The record describes college performance. It does not need a major-league career comparison to become meaningful, and projecting another prospect’s professional power cannot add to that prospect’s NCAA total. College records and scouting evaluations can inform the same conversation while answering different questions.
Hits, wins and strikeouts need their own context
Stephenson’s 418 hits are supported by Wichita State’s College Baseball Hall of Fame profiles. A university retrospective supplies a particularly useful denominator: 288 games. That works out to about 1.45 hits per game, but games are still not the same as at-bats. Walks, batting-order position and shortened appearances can all change the opportunities hidden inside that average.
Wichita State’s discussion of enduring records also describes the longer schedules and different opponent mix of Stephenson’s era. His total deserves recognition on its own terms. A modern hitter’s shorter route through college should be considered when comparing careers, rather than used either to dismiss the old record or to declare that a current player could certainly have broken it.
Heinkel’s 51 wins, also recognized in his Wichita State Hall of Fame biography, show another complication. Pitching victories require both effective pitching and the circumstances needed to receive the decision. Run support and bullpen work enter the story. Powell’s strikeout total isolates a more direct pitcher-batter outcome, but it still combines swing-and-miss ability with innings and continued availability. Read each number as evidence of its particular achievement before turning the table into a ranking of pitchers.
Single-season records capture extraordinary peaks
A season record narrows the comparison to one campaign, but it does not erase differences in schedule length. Three examples from the NCAA table show the range: Incaviglia’s 48 home runs in 1985, Tim Barker’s 142 hits for UCF in 1985 and Derek Tatsuno’s 234 pitching strikeouts for Hawai‘i in 1979. Each is a different way to dominate a spring.
Oklahoma State’s account of Incaviglia’s record season connects the homers with 143 RBI, 285 total bases and a 1.140 slugging percentage. The combination helps explain why this was more than a home-run leaderboard win. Total bases capture extra-base damage, while RBI also depend on the lineup giving a hitter runners to drive home. Those are related achievements, not interchangeable descriptions of the same skill.
The NCAA lists 75 games for Incaviglia’s season. Dividing 48 by 75 produces 0.64 home runs per game. That is a useful way to describe the pace, but a reader should not relabel it as the NCAA’s home-runs-per-game record. The book keeps a separate rate category. A player can lead the cumulative list while somebody with fewer games leads a qualifying rate list.
UCF’s Tim Barker biography supplies a similarly important opportunity picture: 142 hits across 85 games and 324 at-bats. That is about 1.67 hits per game. A high hit total can reflect contact quality, batting average, durability and repeated opportunities; it does not tell you how many of those hits cleared the fence or whether the player frequently walked instead of recording an official at-bat.
Barker’s season also illustrates why individual sentences in older biographies need careful handling. A school feature may describe what was a record when the feat occurred. To identify the record listed in a later national edition, return to that edition’s category rather than carrying every historical superlative forward. The performance remains remarkable even if another category has changed hands.
On the mound, the NCAA’s Tatsuno entry pairs 234 strikeouts with 174.1 innings in 1979. The notation means 174 innings and one out, not 174.1 decimal innings. That detail matters when calculating a rate: baseball’s fraction is based on three outs per inning. Typing the printed innings figure straight into a spreadsheet as a decimal introduces an avoidable error.
Hawai‘i’s account of Tatsuno’s Hall of Fame induction emphasizes the very different schedule environment of his college years. The sensible comparison is to recognize both his ability to miss bats and the innings behind the total. A modern starter can be exceptional over a smaller workload without being close to a cumulative season record. A record chase is a story about pace and remaining opportunities, not simply whether the next outing produces another double-digit strikeout total.
Single-game records demand a closer look at the conditions
Marshall McDougall’s afternoon against Maryland is an unusually clear illustration of several records sharing one box score. On May 9, 1999, Florida State won 26–2 while McDougall went 7-for-7 with six home runs, 16 RBI and 25 total bases. Florida State’s contemporary record notes list the home runs by inning: the second, fourth, sixth, seventh, eighth and ninth.
The sequence is useful because it answers an obvious question: this was not a marathon of extra innings. It also explains the total-base arithmetic. Six home runs contribute 24 total bases; his other hit, a single, supplies the twenty-fifth. The record line is extraordinary without requiring a vague claim that he broke every offensive record in one game.
Seven hits did not become the Division I single-game hits standard. The NCAA edition lists nine for Air Force’s John McBroom against Colorado College on May 10, 1967. That distinction is the point of keeping categories separate: McDougall could set home-run, RBI and total-base records while another player remained above him in hits.
For pitching, Buddy Schultz’s 26 strikeouts against Wright State on April 3, 1971, stand out because the game lasted nine innings. Miami’s Hall of Fame profile identifies that nine-inning setting. The school’s 2024 alumni retrospective describes a 6–0 complete-game shutout and makes clear that it was not a no-hitter. Strikeouts, shutouts and no-hitters measure different outcomes, however often they appear together in highlight language.
Why innings and competition level matter
A nine-inning performance and an extra-inning performance can both be legitimate single-game entries while offering very different numbers of opportunities. The NCAA table’s 12-at-bat entries for Penn teammates Peter Matt and Craig Larsen came in a 21-inning game in 2019. A reader comparing that line with a seven-at-bat afternoon needs the innings label before drawing conclusions about the players’ production.
The opponent also belongs in the description. A national statistical record is not automatically proof of the most difficult matchup in the sport’s history. A school’s classification, the era and the particular contest are context to investigate, not details to silently replace with assumptions about today’s divisions. The official category tells you what qualified; it does not supply a complete strength-of-opposition adjustment.
Team and individual totals need the same care. Florida State’s 26 runs were the team’s score; McDougall’s 16 RBI were his individual contribution under the scoring rules. Do not call a player’s RBI total his team’s run total or imply that every run in a blowout came off his bat. The box score lets both stories remain impressive while keeping them accurate.
Read a record table without losing the baseball story
A record book becomes more useful when it sends you back to a specific baseball question. If a hitter is chasing a season total, compare his current pace with the games his team can still play. If a senior is approaching a career milestone, inspect all of his eligible seasons. If a pitcher has an extraordinary afternoon, preserve the opponent, date, innings and final line before trying to decide where it belongs historically.
The official box score is the bridge between the event and the record. The NCAA scoring manual distinguishes at-bats from several plate appearances that do not count as official at-bats, including walks, hit-by-pitches and sacrifices. That is why a highlight clip, a television graphic and a full statistical line can emphasize different parts of the same appearance without supplying equivalent information.
Consider a hitter who reaches base repeatedly during a series. Walks can make that a valuable offensive weekend even when the hit total is modest. Conversely, a high single-game hit total may reflect many trips to the plate. The record category should fit the question you want to answer. Changing the denominator midway through an argument can make almost any comparison misleading.
A practical checklist for checking an all-time claim
- Name the level. Establish whether the entry is Division I, another NCAA division or a broader college category before comparing totals.
- Read the date and edition. A historical school announcement verifies what happened then; an all-time claim needs the relevant national record entry and an honest cutoff.
- Keep the whole label. Career, season, game, inning, CWS series and championship finals are distinct windows.
- Check the denominator. Games, at-bats and innings help explain cumulative totals, while qualifying minima determine whether rate records are comparable.
- Look for shared entries. A tie is still a record. Do not remove a co-holder simply to make a cleaner headline.
- Separate achievement from projection. A professional scouting judgment or a greatest-player opinion adds interpretation; it does not change the recorded college result.
When two sources disagree, first check whether they are describing different scopes rather than assuming somebody made an arithmetic mistake. A school career total, a Division I total and a total that includes a different college level may all belong to the same person. If the scopes really match, the most useful next step is the underlying record book or official game documentation, not another unsourced summary of the disputed figure.
For a broader route through historical databases, see our college baseball statistics database guide. For an argument about the players rather than the categories, read the historical player comparisons. The records above provide firm landmarks for those conversations, provided the division, time window and source edition travel with the numbers.
Join the conversation
Share a question or a thought about college baseball. Comments are reviewed before they appear. Keep it friendly and on topic.
No comments yet. Start the conversation.
Sign in with Google to leave a comment. Your email address is not displayed.