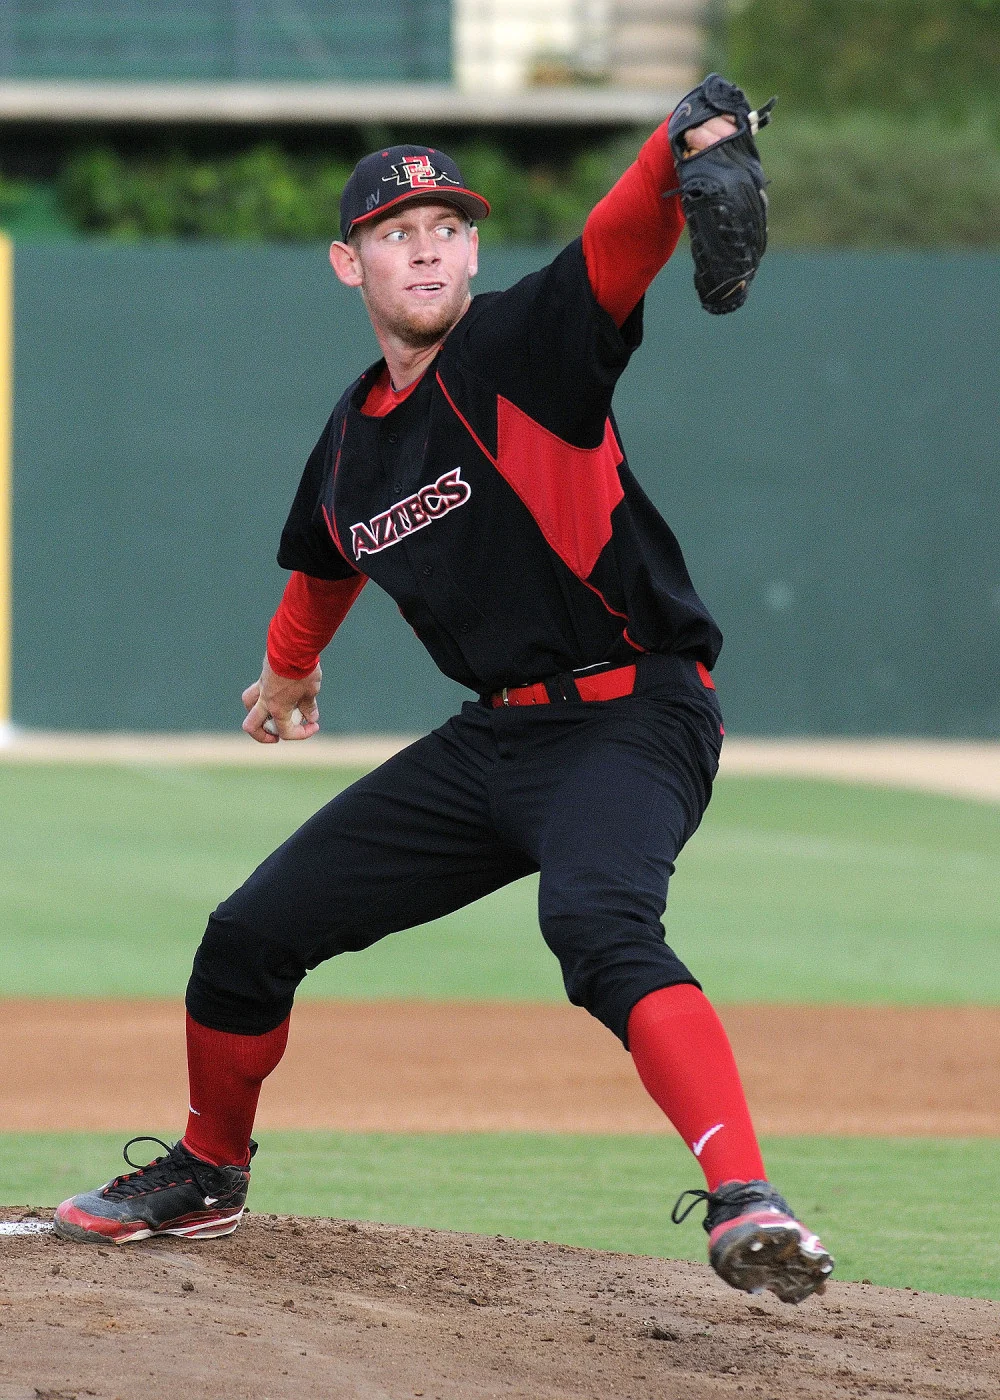
Pete Incaviglia, Robin Ventura, Rickie Weeks, Phil Stephenson, Stephen Strasburg, Paul Skenes and John Olerud belong in a serious discussion of the best college baseball players of all time. Each has a different case: record-setting power, sustained hitting, exceptional career production, dominant pitching or elite two-way performance.
This is a college-only editorial shortlist of seven Division I candidates, not an official NCAA ranking or a claim to cover every deserving player. The comparison uses verified college statistics and achievements, with historical sources reviewed on September 29, 2026. Later major league success does not determine inclusion.
How this college-only shortlist is judged
A convincing all-time college baseball discussion starts with what a player did in college. Professional longevity, a memorable major league postseason and eventual Hall of Fame recognition can make a name familiar, but they do not add a hit or an inning to the college record. This shortlist therefore uses four lenses: the quality of the player's best season, production sustained across the college career, recognition earned at the time, and the responsibilities the player actually carried.
The seven candidates below are representative Division I choices, grouped by the strongest part of their case. The order is not a numerical ranking. A power hitter, a high-average run producer, a starting pitcher and a genuine two-way player solve different problems for their teams. Grouping them makes the comparison more useful than assigning points to unlike accomplishments and presenting the resulting total as objective fact.
The evidence also has boundaries. The NCAA Division I record book explains that its official baseball records begin with the 1957 season. It distinguishes season and career achievements, and its Division I tables are not a comprehensive ranking of everyone who has played college baseball. Earlier players and stars from other divisions deserve their own research rather than being dismissed because they fall outside this article's scope.
Awards provide another useful check. USA Baseball's Golden Spikes Award began in 1978 and recognizes an outstanding amateur player using criteria that include athletic performance and sportsmanship. Winning it supports a player's contemporary standing; it does not settle a career comparison against someone from a different year. Likewise, a national championship can demonstrate performance under additional postseason pressure, but baseball remains a team sport. An exceptional player should not disappear from the discussion because teammates could not carry the club to Omaha.
Read each profile as an argument with a defined basis. Someone who values the strongest single offensive year may favor a different candidate from someone who prizes repeated excellence. Both judgments can be reasonable when the underlying college evidence is explicit. The college baseball teams directory helps place the schools in context; the historical achievements here belong to the seasons identified, not to today's roster.
Pete Incaviglia and Robin Ventura set different hitting standards
Oklahoma State supplies two especially strong answers to the hitting question, but for different reasons. Incaviglia's case begins with the scale of his power. Ventura's begins with repeated production and an extraordinary stretch in which opponents could not keep him out of the hit column. Putting them together shows why even a comparison between hitters needs more than one statistic.
Incaviglia makes the strongest power case
In 1985, Pete Incaviglia hit 48 home runs, drove in 143 runs, collected 285 total bases and slugged 1.140. Oklahoma State's retrospective on his college career documents those numbers, while the school's 2026 media guide preserves them in its NCAA records section. His college career from 1983 through 1985 produced 100 home runs.
The combination matters more than a single spectacular column. Home runs establish the repeated extra-base damage; total bases show the broader accumulation; slugging expresses that production relative to at-bats. A 1.140 slugging percentage means more than one total base per at-bat, not that he recorded a hit in every trip to the plate. That distinction helps explain why the season remains such a striking offensive benchmark.
For readers choosing primarily on the strongest power season, Incaviglia is an especially defensible starting point. His career total also prevents the argument from resting entirely on one hot year. The reasonable limitation is that raw output does not adjust the schedule, equipment or offensive environment to match every later era.
Ventura makes the case for sustained excellence
Robin Ventura's 58-game hitting streak in 1987 offers a different kind of evidence. It is a measure of continuity across many games rather than the height of a single power total. Oklahoma State's College World Series Legends Team announcement places Ventura's contributions in consecutive Omaha appearances in 1986 and 1987. His Golden Spikes recognition in 1988 adds a separate point of contemporary validation after the famous streak season.
A hitting streak is not a complete offensive metric: one single keeps it alive, and a productive game built on walks does not. Ventura belongs here because the streak is an exceptional component of a broader college case, not because every other form of offense can be reduced to consecutive games. Readers emphasizing sustained excellence can reasonably favor that profile while still recognizing the unmatched force of Incaviglia's power argument.
Rickie Weeks and Phil Stephenson reward a wider view of offense
An all-time discussion built only around home runs misses players who created exceptional value through several routes. Rickie Weeks and Phil Stephenson expand the question. Weeks combines an extraordinary career hitting rate with power; Stephenson shows how sustained availability and production can create a remarkable collection of career totals.
Weeks combined batting average with exceptional power
Rickie Weeks played at Southern from 2001 through 2003. The school's career retrospective identifies a .465 batting average and .927 slugging percentage for that college career. Those are career rates, not numbers lifted from a short tournament or an early-season hot streak. The NCAA record table supplies the batting-average denominator: 254 hits in 546 at-bats.
The slugging figure is essential to understanding the case. A very high average can sometimes be discussed as if it represents singles alone. Weeks' production plainly demands a broader reading: he reached an extraordinary hitting rate while also generating substantial total bases. His inclusion also keeps the shortlist grounded in performance across the college landscape instead of limiting serious consideration to whichever programs receive the most national television exposure.
Batting average still has a specific definition. It does not include every plate appearance and is not the same as on-base percentage. The argument for Weeks should use the rate accurately rather than describing .465 as his probability of reaching base in every kind of plate appearance. His verified combination is strong enough without changing what the statistics mean.
Stephenson accumulated value in several ways
Wichita State's Phil Stephenson produced 418 hits, 420 runs, 206 stolen bases and 730 total bases from 1979 through 1982 in the NCAA's historical career tables. That range makes him a particularly useful counterweight to a discussion focused on one signature season. His college case spans getting hits, advancing himself, scoring and accumulating extra-base production.
Four years provided more opportunities than a shorter college career, and that belongs in the comparison. It does not make the accumulated production unimportant: repeatedly being available and productive is part of career value. A fair reading keeps the totals beside the length of the career instead of treating either as a complete verdict.
The stolen-base total also needs its own limits. It demonstrates volume, while a full assessment of efficiency would require caught-stealing information and game context. Stephenson's place here rests on the breadth of his verified college output. Readers favoring an entire collegiate body of work, rather than only its best season, have substantial evidence to consider.
Stephen Strasburg and Paul Skenes define dominant pitching peaks
Pitchers need a different comparison from hitters. Start with run prevention, innings and the ability to finish plate appearances without relying on a ball in play. Then place that production within the season's workload. Stephen Strasburg and Paul Skenes offer two outstanding modern examples, with enough published detail to compare both strikeout volume and strikeout rate.
Strasburg overwhelmed hitters in 2009
San Diego State's 2009 season retrospective records Strasburg at 13–1 with a 1.32 ERA and 195 strikeouts in 109 innings. The Aztecs reached an NCAA regional for the first time since 1991. Those facts establish a college case without needing to borrow anything from his later professional career.
His strikeout rate works out to approximately 16.10 per nine innings. That is not a forecast that every start would contain sixteen strikeouts; it standardizes the season's strikeouts against innings pitched. Combined with the ERA, it shows both dominance over individual batters and strong prevention of earned runs across a substantial workload. The argument is especially persuasive for readers who place heavy weight on a pitcher's best college season.
Skenes paired strikeouts with championship responsibility
LSU's final 2023 award report lists Skenes at 13–2, with a 1.69 ERA, 209 strikeouts and 20 walks in 122⅔ innings. He was also the College World Series Most Outstanding Player as LSU won the national championship. That combines an exceptional statistical season with a documented role in the sport's final tournament.
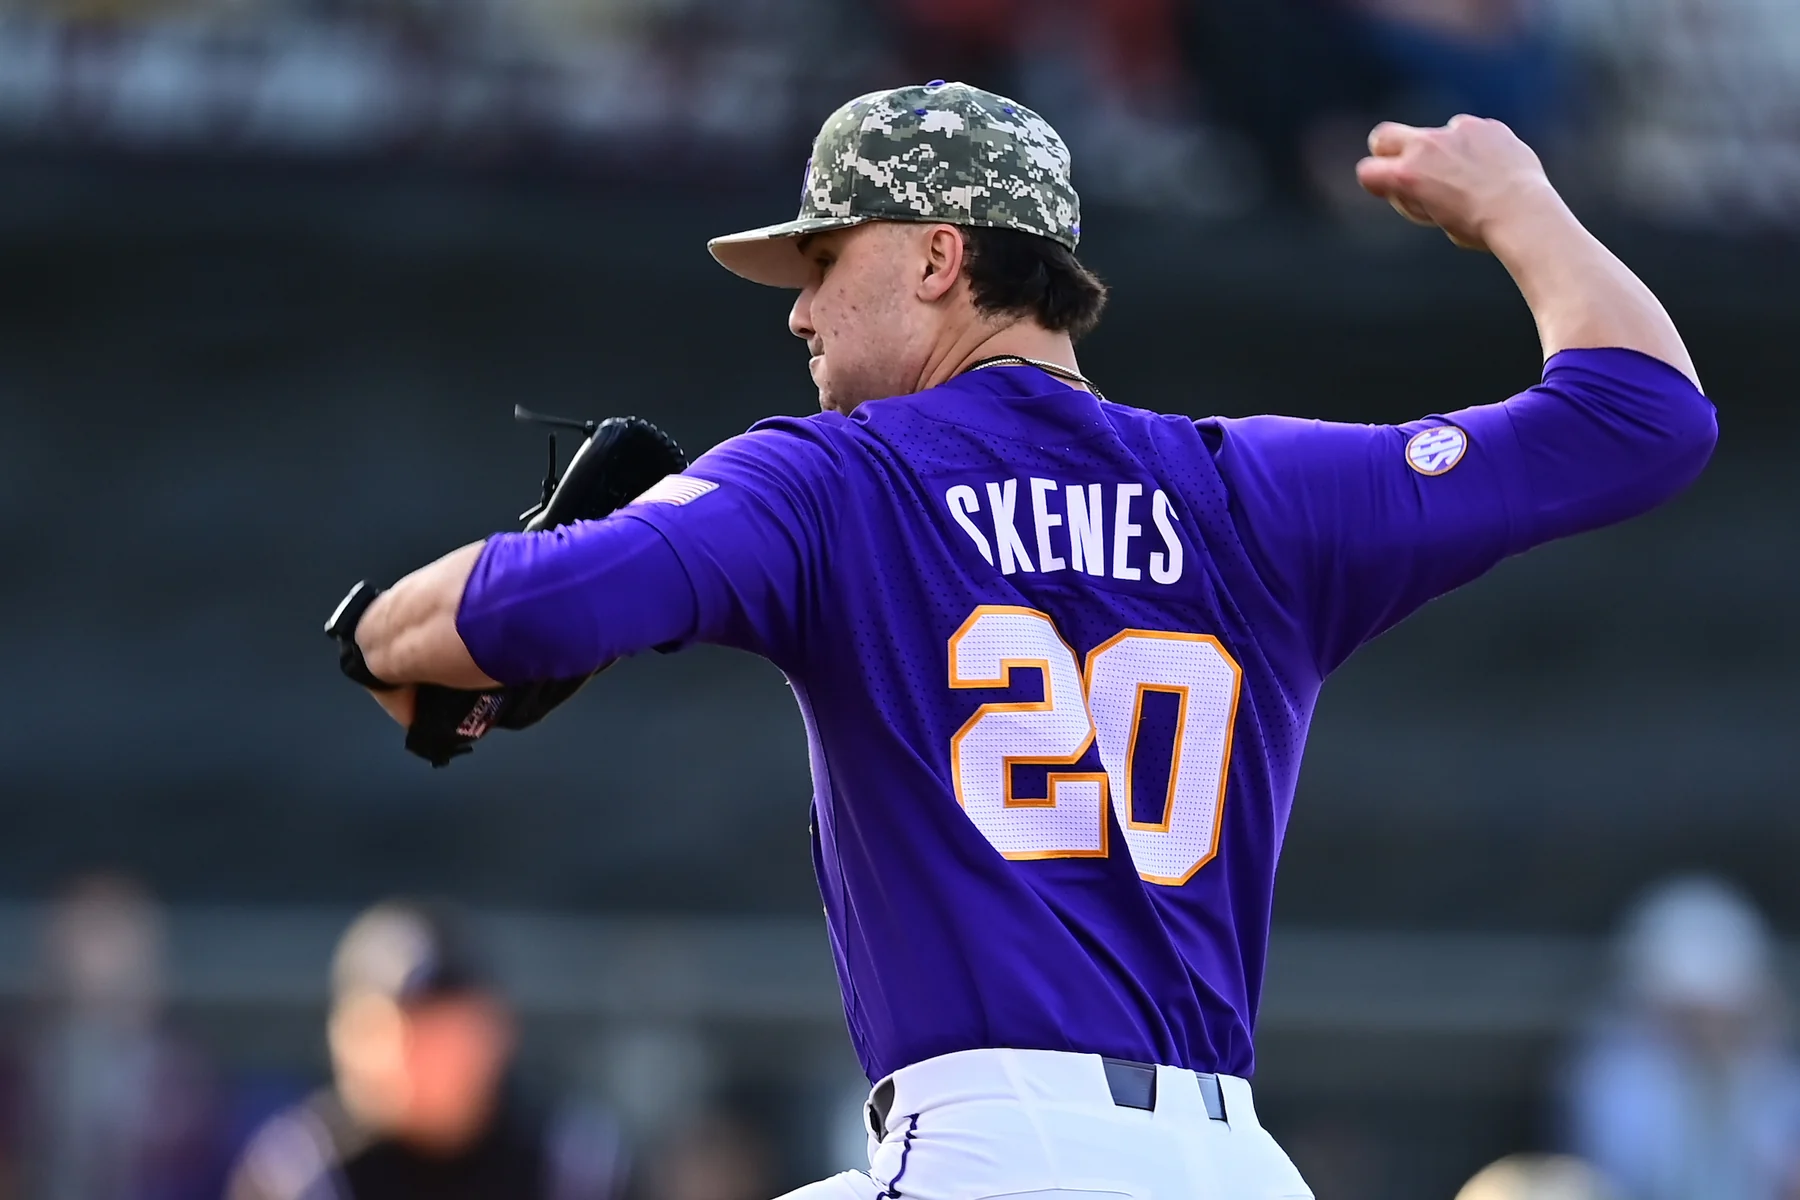
The direct comparison is instructive. Skenes accumulated more strikeouts and more innings in these seasons, while Strasburg had the higher strikeout rate: Skenes' figure is approximately 15.33 per nine. Neither column automatically cancels the other. One measures total work completed; the other measures the frequency of a particular outcome. Skenes' 122.2 innings in standard baseball notation means 122 innings and two outs, which is why the calculation uses two-thirds rather than two-tenths.
Giving Skenes credit for postseason responsibility is reasonable. Treating a championship as proof that he was intrinsically better than every pitcher whose team fell earlier would be much less convincing. These two seasons make strong, distinct cases: Strasburg for extraordinary strikeout frequency and run prevention, Skenes for a larger strikeout workload joined to a championship performance.
John Olerud belongs in a category of his own
John Olerud's 1988 Washington State season changes the comparison because his team received exceptional work on both sides of the ball. At the plate, he hit .464 with 23 home runs and 81 RBI. On the mound, he went 15–0 with a 2.49 ERA. Washington State's Hall of Fame profile and historical account of his college career document the combination. These were simultaneous contributions in one season, not a hitter's best year spliced together with a different pitching peak.
Count the hitting and pitching contributions together
The workload is what makes the two-way argument substantial. Olerud recorded 108 hits while pitching 122⅔ innings and striking out 113. A player who takes an occasional turn on the mound is not carrying the same responsibility. Olerud's pitching line represents a major portion of a staff's work, alongside an offensive season that would warrant attention without any pitching at all.

For an all-time selection, the right question is how much high-level production the team received from that one player. Considering only his batting average understates the pitching role. Considering only the unbeaten record discards the offense and also leans too heavily on a statistic affected by run support and relief pitching. Reading the complete season avoids both mistakes.
There is no useful arithmetic in adding his batting average to his ERA or treating a pitching win as interchangeable with a home run. A practical comparison instead asks whether the batting line is exceptional among regular hitters and whether the pitching line is substantial among regular starters. Olerud clears both of those descriptive tests. Washington State later highlighted that breadth when announcing his Pac-12 Player of the Century selection.
Readers who value the most complete single-season contribution therefore have a clear reason to put Olerud near the front of their own list. That preference does not require pretending he had Incaviglia's home-run total or Strasburg's strikeout rate. It recognizes that the college team benefited from two demanding roles being performed at an exceptional level by the same player.
How to compare these players without pretending eras are identical
The most useful final choice begins by stating what you value. If the question is the greatest power peak, Incaviglia has a particularly clear argument. If it is sustained career hitting, Ventura, Weeks and Stephenson bring different strengths. If it is a dominant pitching season, Strasburg and Skenes provide outstanding evidence. If it is exceptional production in two major roles at once, Olerud demands separate consideration.
| Priority | Candidate to examine first | Evidence that drives the case |
|---|---|---|
| Power peak | Pete Incaviglia | 48 home runs in 1985 |
| Hitting continuity | Robin Ventura | 58-game hitting streak in 1987 |
| Career rate production | Rickie Weeks | .465 average with .927 slugging |
| Career accumulation | Phil Stephenson | 418 hits and 730 total bases |
| Pitching dominance | Stephen Strasburg and Paul Skenes | Verified strikeout, innings and ERA combinations |
| Two-way season | John Olerud | 23 home runs and 15 pitching wins in 1988 |
Then account for the setting. The NCAA's year-by-year statistical trends track changing offensive conditions and identify 2011 as the first season of BBCOR bat standards. That is a concrete reason to avoid assuming an identical scoring environment across decades. It does not authorize a precise claim about how many home runs an older player would hit under newer rules; such a claim would require a defensible model and much more evidence.
Apply the same discipline to opportunity. More games create more chances to accumulate totals, and deeper tournament runs add innings or plate appearances. Rate statistics help describe efficiency, but they should remain beside their denominators. Recognition such as the Golden Spikes winners list adds the judgment of a player's contemporaries without converting an annual award into a complete career score.
Finally, keep the criteria stable when introducing another favorite. Check the player's actual college line, distinguish a peak season from a career total, and explain the role or achievement that earns inclusion. Today's college baseball rankings answer a current competitive question; this historical exercise asks which collegiate performances deserve lasting attention. A persuasive answer can favor one candidate while accurately explaining the strengths of the others.
Join the conversation
Share a question or a thought about college baseball. Comments are reviewed before they appear. Keep it friendly and on topic.
No comments yet. Start the conversation.
Sign in with Google to leave a comment. Your email address is not displayed.