The most useful college baseball stats database depends on your question. Start with NCAA statistics for official national leaders and records, a school's season archive for a detailed team or player line, historical registers for player and school searches, and FanGraphs for recent Division I comparisons using additional metrics. No single database covers every division, era and type of analysis equally well.
This guide explains how to move between those sources, using LSU's published 2023 pitching statistics as a worked example. Coverage and interface details were checked on September 29, 2026. A historical example is deliberately used so that the arithmetic can be repeated against a completed season rather than a changing live leaderboard.
Choose a database by the question you need to answer
Start with the NCAA for an official national leader or record, the school's athletics website for a season's complete team statistics and box scores, and a historical register for tracing a player across teams and years. Those resources solve different problems. A search for “college baseball stats database” becomes much easier once you decide whether you need a current ranking, a final season line, a career history or the details of one game.
| Your question | Best starting point | Check before comparing |
|---|---|---|
| Who leads a division in a category? | NCAA season statistics | Division, season, date and qualification |
| What did a player do for one school? | Official school season statistics | Full season versus conference-only |
| What is an official all-time record? | NCAA or school records book | Record definition and edition cutoff |
| Where did a player compete over several years? | Historical player and team registers | Missing seasons and level of competition |
| What happened in one game? | Official box score and play-by-play | Final or corrected version |
The NCAA baseball statistics index is particularly useful because it brings current rankings, historical material and records resources together. The Baseball Cube's college section organizes discovery around schools, players, conferences and seasons. Its separate summer-league area is a reminder that the word “college” can describe the players' eligibility as well as the competition itself.
For example, a hitter's spring statistics for a university and his summer statistics for a collegiate league club should not be silently added into a single NCAA season. Similarly, a transfer's performance at two schools is a career-research question, while a national batting title is a season-and-division question. A tool can display both kinds of information without making their totals interchangeable.
Access is another practical distinction. Some sites provide public summaries while reserving deeper filters or research features for subscribers. Check the specific feature you need before paying; a historical season page may be visible even when a cross-season search is restricted. None of the resources listed here should be assumed to contain every player, every division and every year with equal detail.
If your immediate question is simply who won, use our college baseball scores page first. A results page can lead you to the game you need, but the final official box score is the better destination for individual statistical research.
Find official NCAA season leaders and records
Use the NCAA.org baseball statistics page as a durable navigation hub. Under “Current Rankings,” it provides separate Division I, II and III national-ranking links and separate team-by-season links. The page also points to archived national rankings from 2000 onward and an older statistics archive covering 1989–2000. Choosing the correct branch first is more reliable than relying on a search result that happens to display a familiar player's name.
Start with the division, season and statistical category
- Open the official baseball statistics index and choose the relevant division.
- Set or confirm the season before selecting a team or individual category.
- Choose the measure you need: a total such as home runs, or a rate such as batting average.
- Read the table's date, qualification rules and column labels before recording its leader.
- Save the season and category with the result so another reader can repeat the lookup.
The distinction between totals and rates is essential. A reserve who goes two-for-three has a higher batting average than a regular hitting .350, but the tiny sample does not automatically make him a qualified national leader. The NCAA statistics policies discuss ranking minimums; use the requirements associated with the specific college category instead of borrowing an MLB qualification rule.
Some NCAA statistics pages may present a browser-verification screen. If that happens, return to the NCAA.org index and try the relevant archive or official school statistics. A search preview can help locate a page, but it is not a substitute for seeing the season, date and column headings in the actual table.
Use the records book for all-time claims
A season leaderboard cannot establish an all-time record by itself. Open the relevant NCAA records book and identify whether the claim is for a game, a season or a career. The Division I book, for example, separates individual records from annual leaders and specifies that its D1 career records count the years played in Division I. That is a meaningful restriction for a player whose college route included another level.
Also check the edition's endpoint. A file available today can still contain tables ending several seasons earlier. Do not treat its absence of a recent performance as proof that the performance did not happen. Compare the published record with the school's later official announcement or updated record book.
Finally, distinguish College World Series records from full-season and career records. The same player can appear in all three, but the games counted are different. Writing the scope into your note—“D1 career,” “2025 full season” or “CWS games”—usually prevents the most consequential comparison mistakes.
Use school statistics to reconstruct a player's season
Official school archives are often the quickest route from a familiar name to a complete statistical line. Find the baseball statistics archive, choose the season, and open the final cumulative statistics. Keep the roster or player biography in another tab to confirm identity. The archive can also supply game-by-game results when you need to understand how the season developed rather than simply quote its endpoint.
A worked example with LSU's pitching records
From LSU's statistics archive, select the 2023 season and open the final cumulative table. The page distinguishes overall statistics from conference-only statistics. In the overall pitching table, Paul Skenes has 19 appearances and 19 starts, 122.2 innings, 23 earned runs, 20 walks and 209 strikeouts, with a 1.69 ERA.
That line allows two useful checks. First, baseball innings notation is not ordinary decimal notation: 122.2 means 122 innings and two outs, or 122⅔ innings. Divide 23 earned runs by 122⅔ and multiply by nine to obtain 1.6875, which rounds to the displayed 1.69 ERA. Dividing 209 strikeouts by the same innings total and multiplying by nine gives approximately 15.33 strikeouts per nine innings.
The calculation is not an alternative official statistic; it is a way to verify that you copied the inputs and interpreted the columns correctly. Treating 122.2 as a decimal fraction produces a subtly incorrect result. That error becomes more serious when a spreadsheet combines many pitchers with one-third and two-thirds innings.
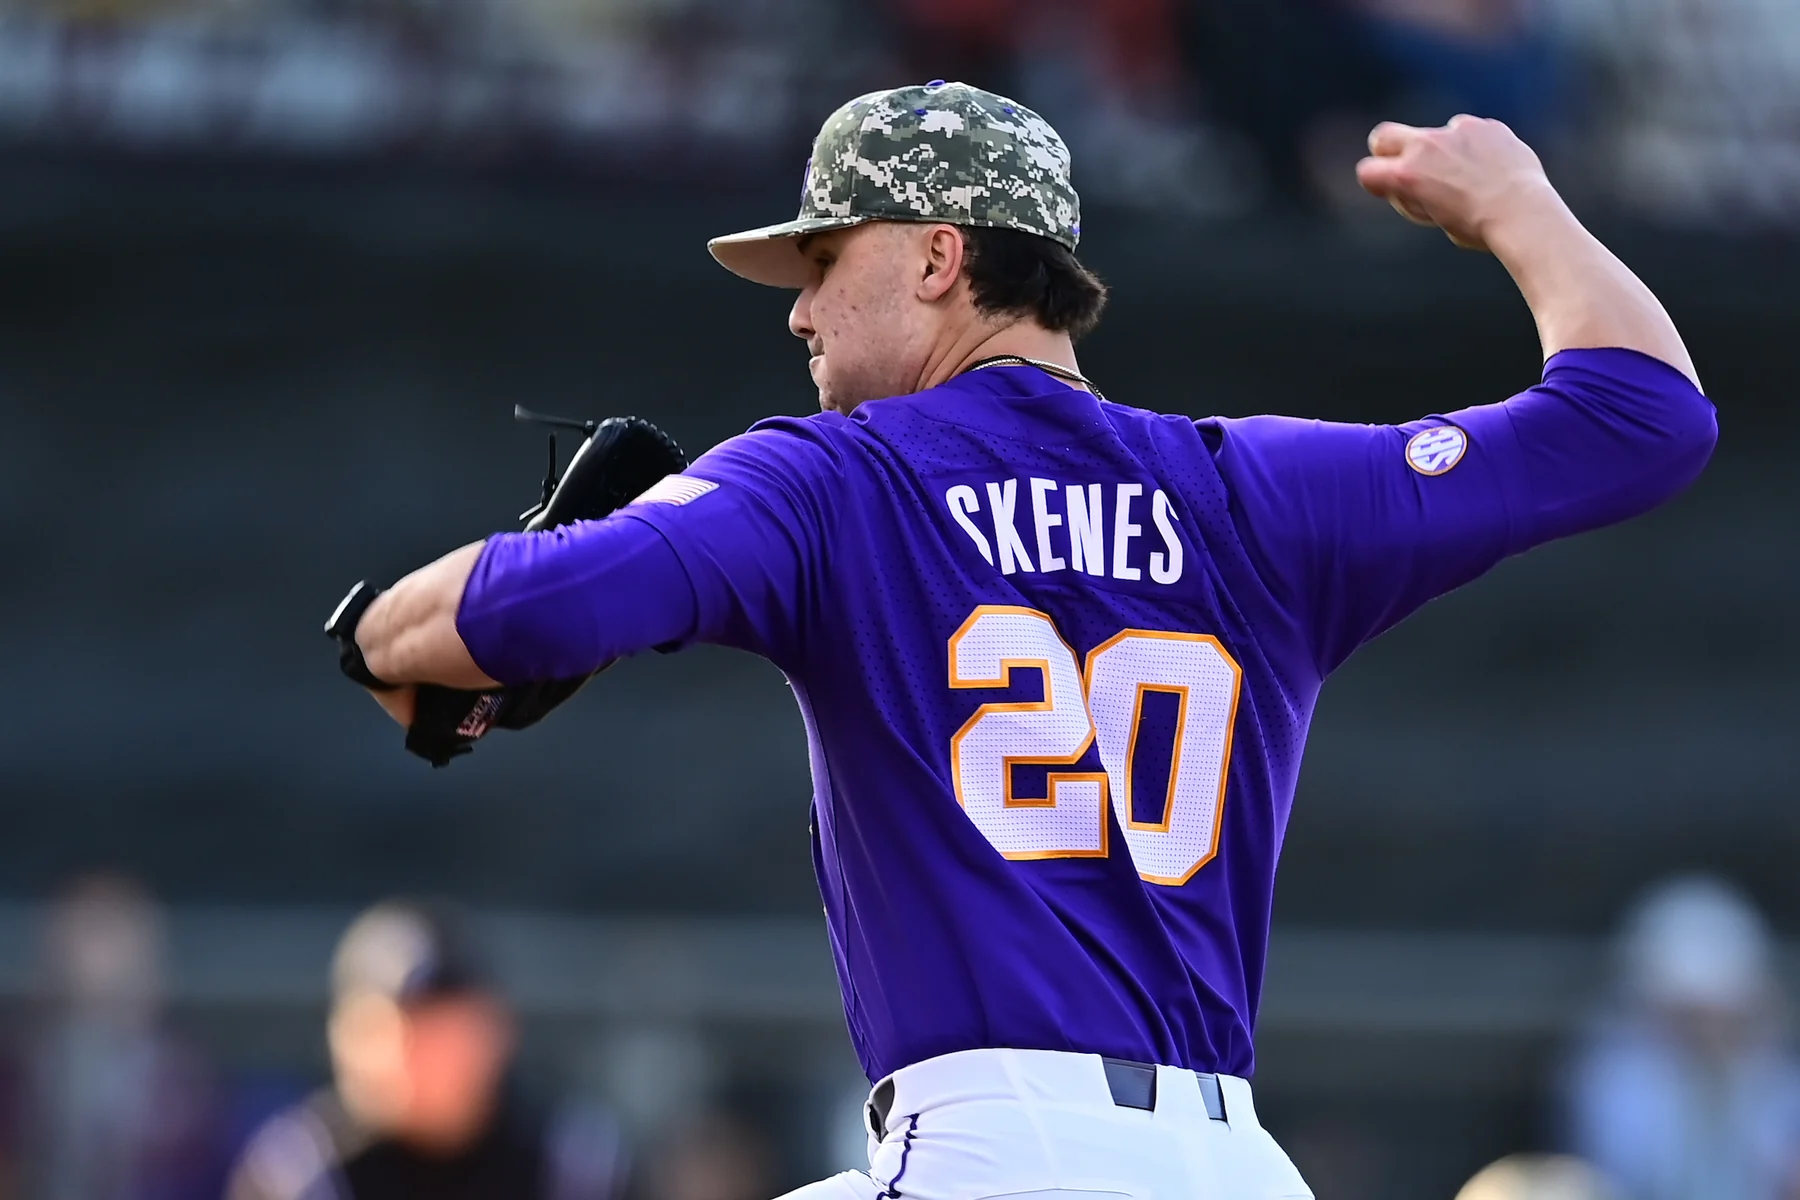
Now compare the final table with a dated award announcement. An article written before the postseason ended can legitimately show a different ERA or strikeout total. LSU's July 1, 2023 season-ending Skenes recognition corroborates the completed-year figures. Matching dates resolves many apparent disagreements without deciding that one source is unreliable.
Use the same approach for a hitter: copy hits and at-bats from the correct season, check the batting average, then distinguish walks and hit-by-pitches when reading on-base percentage. For a game-specific claim, return to that game's box score. For a career claim, repeat the process across seasons and schools. A single outstanding LSU season should never silently become the player's entire college career.
Trace historical players through the baseball registers
Historical registers are useful for finding the connections that a single school's website cannot show in one place. The Baseball Cube provides routes through schools, seasons and individual players. Baseball-Reference also offers a college register, although access to its pages may sometimes be restricted by browser checks. Use a register to discover the right school-season combinations, then verify an important figure against the institution's own records where possible.
Search a school and season before trusting a career total
Begin with the player's name and confirm the associated colleges. Then select the relevant seasons and inspect the competition label on each row. The Skenes register entry identifies both Air Force and LSU. His official LSU biography confirms the sequence: Air Force in 2021 and 2022, followed by LSU in 2023. A database search limited to LSU cannot answer a question about all of his college pitching or hitting.
Tommy White provides another useful test. His LSU biography includes his earlier NC State season. If you are assembling a college career line, find the NC State row as well as the LSU rows. If you are writing about LSU program records, follow LSU's stated record definition instead of assuming those earlier numbers belong in a school total.

For players with common names, match school, year and other identifying details before combining entries. Preserve the original spelling in your notes, including initials and suffixes. If a season is missing, label it missing. A blank database row does not establish that the player had zero hits, did not play or attended a different school.
Keep summer baseball and college competition separate
A player's register can contain NCAA seasons, collegiate summer leagues and later professional baseball. Those rows belong to different competitions even when they share the same calendar year. Filter to the exact scope of your question before adding totals. A spring college batting average should not absorb summer at-bats simply because the player remained enrolled at a university.
When calculating a combined average, add hits and at-bats first, then divide. Do not take the simple mean of two displayed batting averages when the opportunities differ. Apply the same principle to pitching: combine earned runs and innings correctly before recomputing ERA. This gives a reproducible descriptive total; it does not erase differences in opponents, environments or levels of play.
Add advanced leaderboards when the basic line is not enough
FanGraphs adds a useful second layer after you have checked the official season line. Its college leaderboards cover Division I data from 2021 onward, according to the publisher's college data announcement. That makes it useful for recent comparisons, but it cannot by itself resolve an argument about a hitter from the 1980s. Start by selecting the season and batting or pitching view, then narrow the team or conference only when that restriction belongs in your question.
The distinction between raw production and adjusted production matters here. FanGraphs says its college wRC+, ERA- and FIP- are adjusted for conference, but not for ballpark. Those numbers therefore offer context that a bare batting average or ERA lacks, while leaving another important source of variation untreated. A hitter's home environment can still matter. Calling one of these a fully park-neutral measure would overstate what the database provides.
Filters and sample size change the comparison
Consider comparing two hitters with the same batting average. The Standard view can establish their opportunities and basic production; the Advanced view can help distinguish their walks, strikeouts and overall offensive contribution. Keep plate appearances beside the rate statistics. A short reserve stint and a full season against conference pitching do not offer the same evidence, even when the smaller sample produces the higher rate. Run the comparison once with the intended qualification setting and once with the sample sizes visible, then explain any deliberate inclusion of an unqualified player.
The publisher's feature guide also describes practical limits: college leaderboards have Standard and Advanced views, without the Dashboard and customization choices available elsewhere on the site. Do not assume every MLB tool has a college equivalent. Data are updated daily during the season, so a saved comparison needs a retrieval date; export access is a separate membership feature, not something to promise every visitor for free.
For a player who has already entered professional baseball, college rows may be hidden on the player page when there is more than a year of minor league data. Use the College toggle above the tables before concluding that the collegiate record is missing. Finally, treat an adjusted leaderboard as evidence about measured performance. It does not directly measure a pitcher's future durability, a hitter's defensive value, or the quality of every individual opponent faced.
Build a comparison you can check again later
A useful comparison leaves enough information for someone else to reproduce it. Put the question at the top of your worksheet: for example, starting pitchers in Division I during a named completed season, using all games and a stated innings minimum. That single sentence prevents a surprising number of mistakes. Without it, a conference-only line, a partial season and a final national total can all end up in adjacent columns looking equivalent.
Record the following information alongside every line you intend to quote:
- Player name, school, season and division, including any transfer that affects identity.
- Source page and retrieval date, with the table's own update date when available.
- All games or conference games, regular season or final season, and the qualifying minimum.
- Raw counting statistics needed to reproduce the rate: hits and at-bats for batting average; earned runs and innings for ERA.
- Definitions for adjusted metrics and a note identifying any missing seasons or uncertain records.
Those fields turn a copied number into a checkable claim. Suppose you are comparing the Skenes season discussed above with another pitcher's year. Store 122 innings and two outs in a form your spreadsheet understands, retain the 23 earned runs, and state that the line includes LSU's completed 2023 season. If the other pitcher is represented by a pre-tournament snapshot, obtain the final line before drawing a conclusion. Saving more decimal places does not repair a mismatch in scope.
When two sources disagree, return to the official team archive and the relevant game records. The NCAA statistics policies provide the governing framework for official reporting and corrections; your spreadsheet should preserve the corrected value and note why it replaced the earlier one. Do not quietly choose whichever number makes the argument stronger. Likewise, a school record and a national record require different comparison sets, even when the player's number is identical.
Keep statistical findings separate from a poll position. Our college baseball rankings page gives another kind of context, while a database answers defined numerical questions. The strongest finished comparison uses both appropriately: verified production to describe what happened, and clearly identified ranking or scouting judgments to explain how someone evaluated it. Save the source trail with the conclusion, so a future update requires checking changed evidence rather than rebuilding the entire search.
Join the conversation
Share a question or a thought about college baseball. Comments are reviewed before they appear. Keep it friendly and on topic.
No comments yet. Start the conversation.
Sign in with Google to leave a comment. Your email address is not displayed.