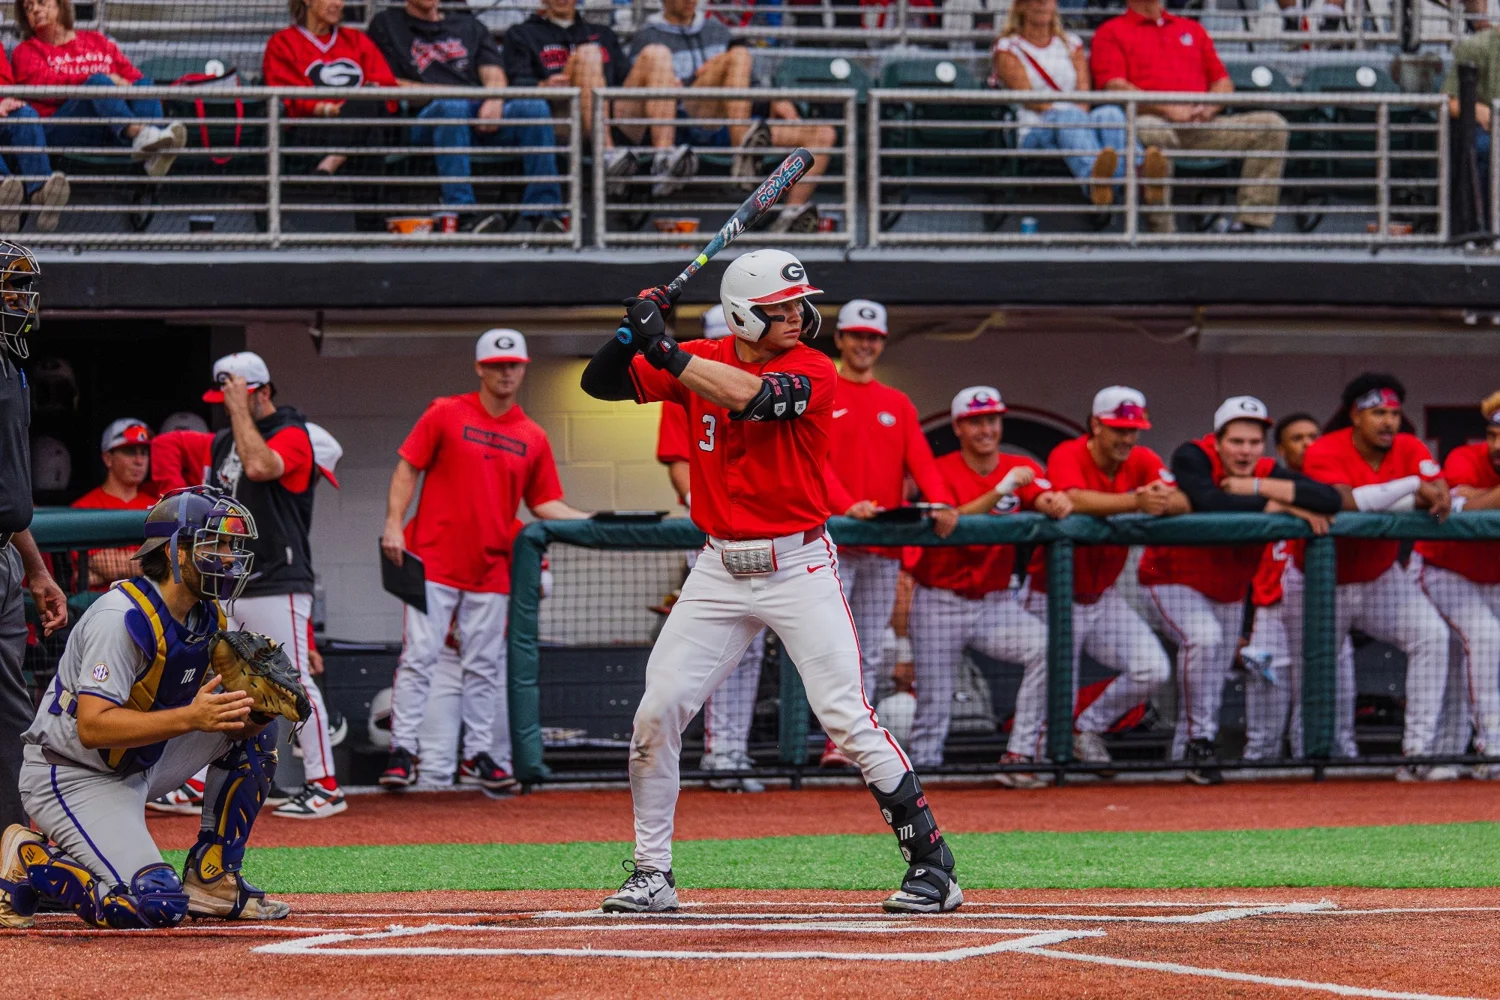
Georgia catcher Daniel Jackson, Arizona State hitter Landon Hairston, Louisville slugger Tague Davis and an outstanding group of pitchers belong near the center of any 2026 college baseball review. Their cases are different: national awards, complete offensive seasons, record-setting power and substantial run prevention. This is an editorial shortlist for the completed NCAA Division I season, checked October 20, 2026, with performance separated from future draft potential.
What earns a place on a completed-season shortlist
Begin with what happened on college fields in 2026. A preseason All-America selection identifies expectations; it cannot establish the final season's best performance. A draft board estimates a future professional outcome; it cannot replace the college record either. For this shortlist, completed statistics and the relevant award organizations provide the factual base, with role and workload explaining the comparisons.
Two confirmed national honors make useful anchors. USA Baseball's winners archive identifies Jackson as the 2026 Golden Spikes Award winner. The ABCA/Rawlings announcement names UC Santa Barbara's Jackson Flora its NCAA Division I Pitcher of the Year. Those awards recognize different responsibilities and should remain attached to the player and organization that earned or presented them.
The NCBWA's 2026 All-America release adds a wider set of evidence. Its first team includes Jackson, Davis, Hairston and UCLA shortstop Roch Cholowsky, plus a starting-pitcher group containing Flora, USC's Mason Edwards, Texas' Dylan Volantis, Mississippi State's Tomas Valincius, Florida's Aidan King and North Carolina's Jason DeCaro. That is a useful field of candidates rather than proof of one universally agreed numbered ranking.
Consider three dimensions when comparing them. First is production: reaching base, creating extra bases or preventing runs. Second is responsibility: everyday defensive work, starts, innings and the amount of baseball carried. Third is context: the competition, role and stage at which the evidence was recorded. A dominant rate in a limited sample and a strong full-season total can both matter without being the same achievement.
The selections below emphasize clear, verifiable cases across those dimensions. They do not claim to cover every deserving player or every division. Division II, Division III, NAIA and junior-college baseball have their own outstanding performers and award structures. Keeping the scope at Division I lets the statistical comparisons remain useful while giving the individual seasons enough space to explain why they stood out.
The hitters who created different kinds of offensive value
Jackson, Hairston and Davis make a useful offensive comparison because each reached an exceptional outcome through a different profile. Jackson combined an award-winning bat with catching responsibility. Hairston's season joined contact with an unusual quantity of extra-base damage. Davis supplied the largest home-run total of the three. Recognizing those distinctions is more informative than choosing one statistic and forcing every player into its order.
Put complete offensive seasons beside the power totals
Georgia's season-ending award report credits Jackson with 32 home runs and 87 RBI. Those numbers belong alongside his Golden Spikes recognition, not instead of it. His case includes the range of responsibilities carried by a regular catcher as well as the offensive production. A hitter who contributes in several parts of the game deserves to be evaluated across those parts.
Hairston's completed 2026 line featured a .400 average, 28 home runs and 81 RBI. Arizona State's national-award release confirms Baseball America's Player of the Year selection and details 20 doubles, two triples and an .860 slugging percentage. The extra-base mix is a central part of the story: his impact was not confined to balls that cleared the fence.
Batting average measures hits per at-bat, while on-base percentage also accounts for other ways of reaching. Slugging gives additional weight to extra bases. Read those measures together. Two players with similar averages can create very different amounts of damage, and a hitter with fewer hits can preserve offensive value through walks. The question is how often the player avoids an out and what he produces when he makes contact.
Hairston's 81 RBI also came from the top of ASU's order, as the school notes. That is useful lineup context, but RBI should still be interpreted with opportunity in mind. Teammates, batting position and the number of runners available influence how many runs a hitter can drive in. Credit the completed result without pretending RBI is a pure individual rate independent of the rest of the lineup.
Give the home-run leader credit without making every comparison a home-run race
Davis finished with 34 home runs and 98 RBI in 57 games according to Louisville's final statistics. His .355 average, .443 on-base percentage and .848 slugging percentage show that the home-run total sat inside a productive overall offensive season. Louisville also records his school single-season home-run and RBI marks and the ACC single-season home-run record.
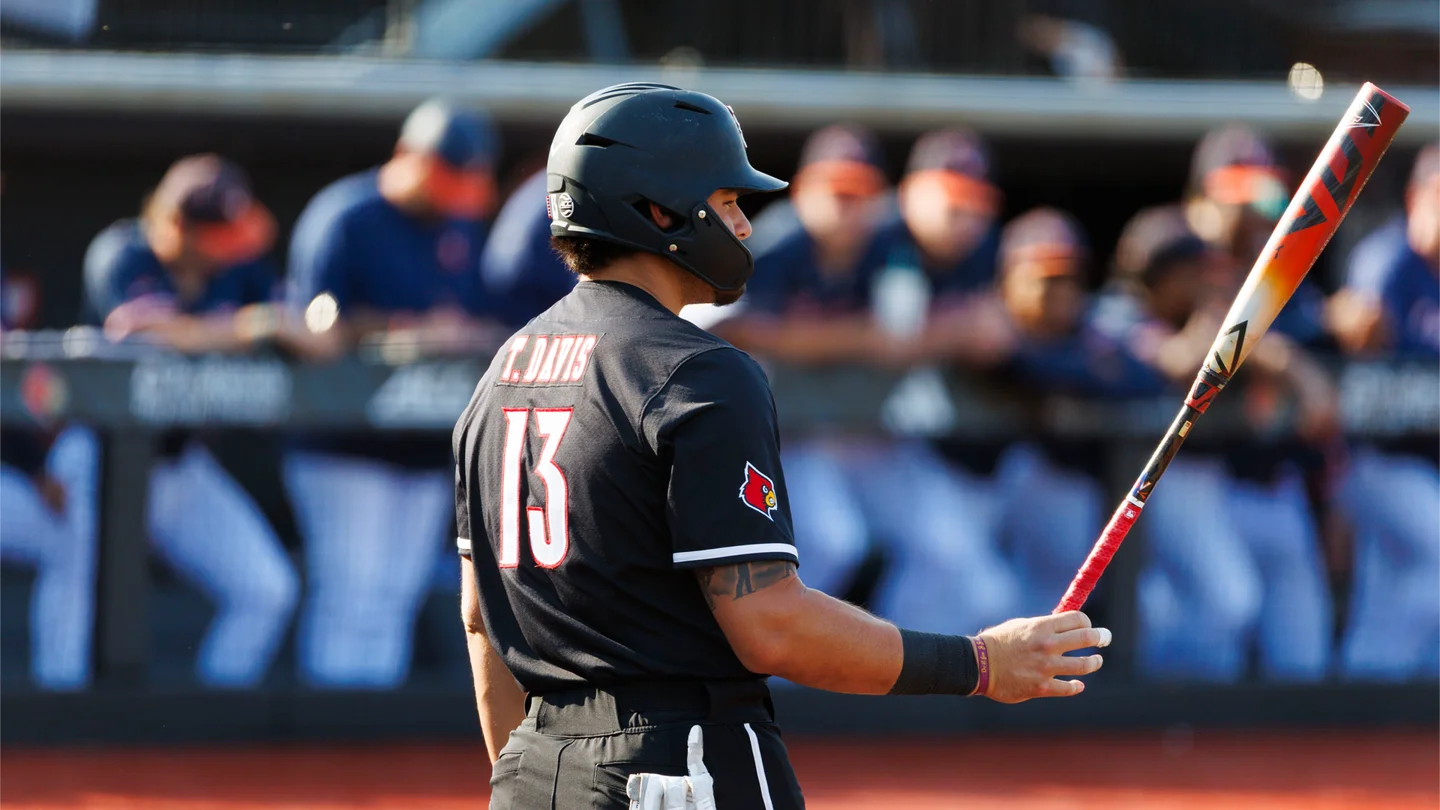
That performance earns a distinct place in the season review. It also leaves room for Jackson and Hairston to make strong overall cases. A home run creates immediate value, but the plate appearances between home runs still count. Walks, other extra-base hits, strikeouts and defensive work prevent a complete comparison from becoming a single-column leaderboard.
Be particularly careful when comparing season totals with a rate. Davis's total and Hairston's slugging percentage answer related but different questions. One counts a specific event; the other describes total bases per at-bat. A useful comparison first states the same completed-season scope, then explains what each measure captures. It does not treat the largest number in whichever column is being discussed as an automatic verdict.
Cholowsky supplies another reason to widen the lens. His national finalist recognition and first-team shortstop selection place him firmly in the 2026 conversation even in a discussion led by unusually powerful bats. When the defensive job differs, the offensive benchmark alone cannot describe the full season. That matters when moving from a hitter shortlist to a shortlist of players.
The pitchers who paired run prevention with substantial responsibility
Flora's strongest argument is the combination of an exceptional rate and a substantial body of work. The College Baseball Foundation's award announcement records a 12–0 season across 16 starts, with a 1.06 ERA, 0.85 WHIP and 133 strikeouts in 102 innings. That is not merely a brief low-ERA stretch. It is a season-long starting workload paired with very limited traffic and scoring.
The Foundation's selection and Flora's ABCA/Rawlings honor reinforce the case without requiring an invented universal pitching ranking. His record provides a clear anchor for the 2026 review. ERA and WHIP do not measure exactly the same thing: the former counts earned-run prevention relative to innings, while the latter tracks walks and hits per inning. Reading both makes the underlying dominance easier to understand.
Edwards offers a different emphatic case. USC's post-season summary credits him with 169 strikeouts, a 2.07 ERA and an 8–0 record, along with Big Ten Pitcher of the Year recognition. The strikeout total distinguishes his season even when another pitcher's ERA is lower. Credit the outs he created without putting every pitcher through an ERA-only comparison.
King belongs in the discussion through command and dependable responsibility. His Florida biography records all 16 scheduled starts, 97 innings, a 3.21 ERA, 92 strikeouts and only 19 walks. It also confirms his SEC Pitcher of the Year award. The ratio of strikeouts to walks provides one useful view of how he controlled opportunities, while the starts and innings show the extent of the task he carried.
Read the workload behind the ERA
A pitcher's ERA is scaled to nine innings, so compare it with the innings behind it. A reliever can be excellent over a smaller amount of baseball; a starter can provide value by repeating a strong performance across a much larger workload. Neither role should be dismissed, but the denominator must remain visible. Fifty impressive outs do not describe the same season as a hundred innings.
The same applies to strikeouts. A total describes accumulated outs, while a rate describes their frequency relative to opportunity. Use both alongside walks. A pitcher who creates swings and misses but repeatedly gives away baserunners has a different profile from one who limits traffic through strike throwing. Fielding, park and opponents still influence the results, so these measures should inform a comparison rather than pretend to remove every contextual difference.
Relief work deserves its own attention. The NCBWA first team included several relievers as well as starters, recognizing that the final innings and inherited situations can matter greatly. A save total alone cannot describe the difficulty or volume of those appearances. When comparing a reliever with the starters above, ask how many innings he actually carried, how often he entered difficult situations and which facts the available record establishes.
Those distinctions preserve the value of the completed seasons. Flora's rate-and-volume combination, Edwards's strikeout production and King's command across a full starting schedule are separate reasons to remember 2026. They do not need to be flattened into one statistic to belong in the same review.
Catching and defensive assignments change the player comparison
Jackson's catching work is part of his season, not an optional bonus added after comparing home runs. Georgia's final biography records 57 starts behind the plate and ten at designated hitter, and the university confirmed his Buster Posey Award. Keeping the assignments visible explains why an overall player review can differ from an offense-only list.
A catcher handles receiving, blocking and throwing opportunities while working with different pitchers. Some of that contribution is visible in the basic record, and some requires more detailed evidence. A fielding percentage alone does not capture every difficult pitch kept in front of the plate or the quality of a receiving opportunity. Avoid supplying an imagined defensive run total to fill that gap. Recognize the responsibility and use the measurements that actually exist.
Georgia Tech's Vahn Lackey provides another strong catching case. The ACC named him its Defensive Player of the Year, and the school's post-season report records a .397 average, .519 on-base percentage and .772 slugging percentage with 20 home runs across 61 games. That combination gives a 2026 review another player whose value extends beyond one offensive event.
Jackson and Lackey should not be confused simply because both played in Georgia and earned catching recognition. They represented different universities and different conferences. Nor does one award erase the other player's performance. Naming the player, school and award organization keeps an honest comparison possible while avoiding the idea that every trophy is one shared vote.
Kelly adds a different role problem. West Virginia's final biography records 63 starts split between catcher and second base, with a .382 average, 19 home runs and 63 RBI. Some All-America selections categorized him at second base and others at catcher. That is a reason to explain his assignments rather than insist that one position label tells the entire story.
For shortstops and players moving among positions, ask the same basic questions: where did they actually play, how often, and what can the record demonstrate? Offensive production remains important, but the defensive job changes the full comparison. An everyday player carrying a demanding assignment deserves to have that work described alongside the batting line.
Keep the 2026 verdict separate from a future draft board
The best completed college season and the most attractive professional projection are different judgments. The first asks what a player contributed in 2026. The second asks what his skills may become against a different standard of competition and over a different time horizon. A draft selection can be relevant biographical context, but it does not retroactively determine who produced the strongest college season.
That distinction protects both kinds of evaluation. An older player can deliver an outstanding college season without receiving the same projection as a younger player. A highly regarded prospect can have a shorter or less productive college season while still attracting professional interest. Neither situation requires rewriting the completed record. Recognize what happened first, then discuss future possibilities under a separate question.
Use final statistics and the correct competition scope
Award announcements often arrive before every team has finished playing. Their statistics are snapshots at publication, even when the award itself is final. King's May SEC award announcement, for example, described 79 1/3 innings; his completed-season biography records 97. Those figures are not interchangeable. For a retrospective, the final all-games record is the appropriate basis for comparing season totals.
The competition filter matters as well. A conference-only table excludes nonconference games and can differ from the overall line in both opportunity and opponent mix. A regional or College World Series record covers another subset. Before copying a number, identify the year, division, statistical category and whether the table includes the whole college season. Summer-league and professional appearances belong in separate records.
The site's college baseball statistics guide helps with those checks. Its historical player comparison addresses a broader career-and-era question. Neither should be collapsed into a 2026 award ballot. A single completed season can be excellent without automatically proving an all-time career claim.
The clearest 2026 cases therefore remain specific: Jackson's national recognition and catching responsibility, Hairston's complete offensive damage, Davis's extraordinary power production, Flora's run prevention across a major workload, Edwards's strikeouts and King's command. Lackey and Kelly add further evidence that position and role belong beside the batting line. Those are concrete reasons to remember the season, with room for other well-supported selections rather than a claim that one numbered list settles every comparison.
Join the conversation
Share a question or a thought about college baseball. Comments are reviewed before they appear. Keep it friendly and on topic.
No comments yet. Start the conversation.
Sign in with Google to leave a comment. Your email address is not displayed.