There were 12,649 NCAA Division I baseball participants in 2024–25, according to the NCAA's latest linked annual participation report checked on September 29, 2026. That national total is different from the 34-player roster limit used by schools participating in the House settlement framework. Here is how to read the official count, understand larger rosters and compare a team's personnel with its actual playing opportunities.
How many Division I baseball players are there?
The NCAA reported 12,649 Division I baseball players for the 2024–25 academic year. That is the dated national participation figure in the latest annual report linked from the NCAA research page when checked on September 29, 2026. The same table lists 300 Division I baseball teams and an average squad size of 42.2. Those three numbers belong together: they describe one reporting period, rather than a mixture of an old player total and a newer directory of schools.
Across all three NCAA divisions, the report records 41,580 baseball participants. Division II accounts for 12,369 and Division III for 16,562. D1 therefore represents about 30 percent of the NCAA baseball population in that release. A search result that says there are more than 40,000 college baseball players may be describing all NCAA divisions; it is not necessarily contradicting the D1 figure. NAIA, junior college and club baseball require additional datasets.
| 2024–25 NCAA baseball scope | Reported participants |
|---|---|
| Division I | 12,649 |
| Division II | 12,369 |
| Division III | 16,562 |
| All three NCAA divisions | 41,580 |
The figures come from the men's participation table on page 93 of the NCAA Sports Sponsorship and Participation Rates Report. This is a much firmer answer than estimating the population from a television conference list or a recruiting website's rounded school count.
Use the reporting year, not a made-up live total
There is a useful distinction between a number checked in 2026 and a number measuring the 2026 season. Here, the verification date is current, but the participation period is 2024–25. We have not substituted a calculated 2026 estimate for a published national census. That distinction is especially important while roster policies and membership are changing.
For a presentation, recruiting discussion or school project, cite the answer as “12,649 NCAA Division I baseball participants in 2024–25.” Keep the year attached when copying it into a chart. If a later NCAA release becomes available, replace the entire dated row rather than updating only the headline year. The NCAA participation hub is the starting point for that update. It also makes clear that the underlying information comes from annual school reporting, which is a different process from counting names on live roster pages.
What the NCAA participation count actually measures
A participation total answers a broader question than “How many players entered a game?” Under the definition in the NCAA report, being listed on the relevant team records, practicing with varsity coaches, or receiving athletics-related aid can establish participation during the academic year. Players who do not compete because of a medical issue or a redshirt can still belong in the count. The national figure therefore describes the baseball program's student-athlete population rather than a list of everyone who logged a plate appearance.
Players, teams and statistical appearances are different counts
Consider a pitching prospect who spends a season developing with the varsity squad without recording an inning. He can be part of the program's participation population while being absent from the pitching results. Likewise, a position player who contributes in practice may have no batting line. Those examples explain the definitions; they do not diagnose any particular player's eligibility or injury from a missing statistical entry.
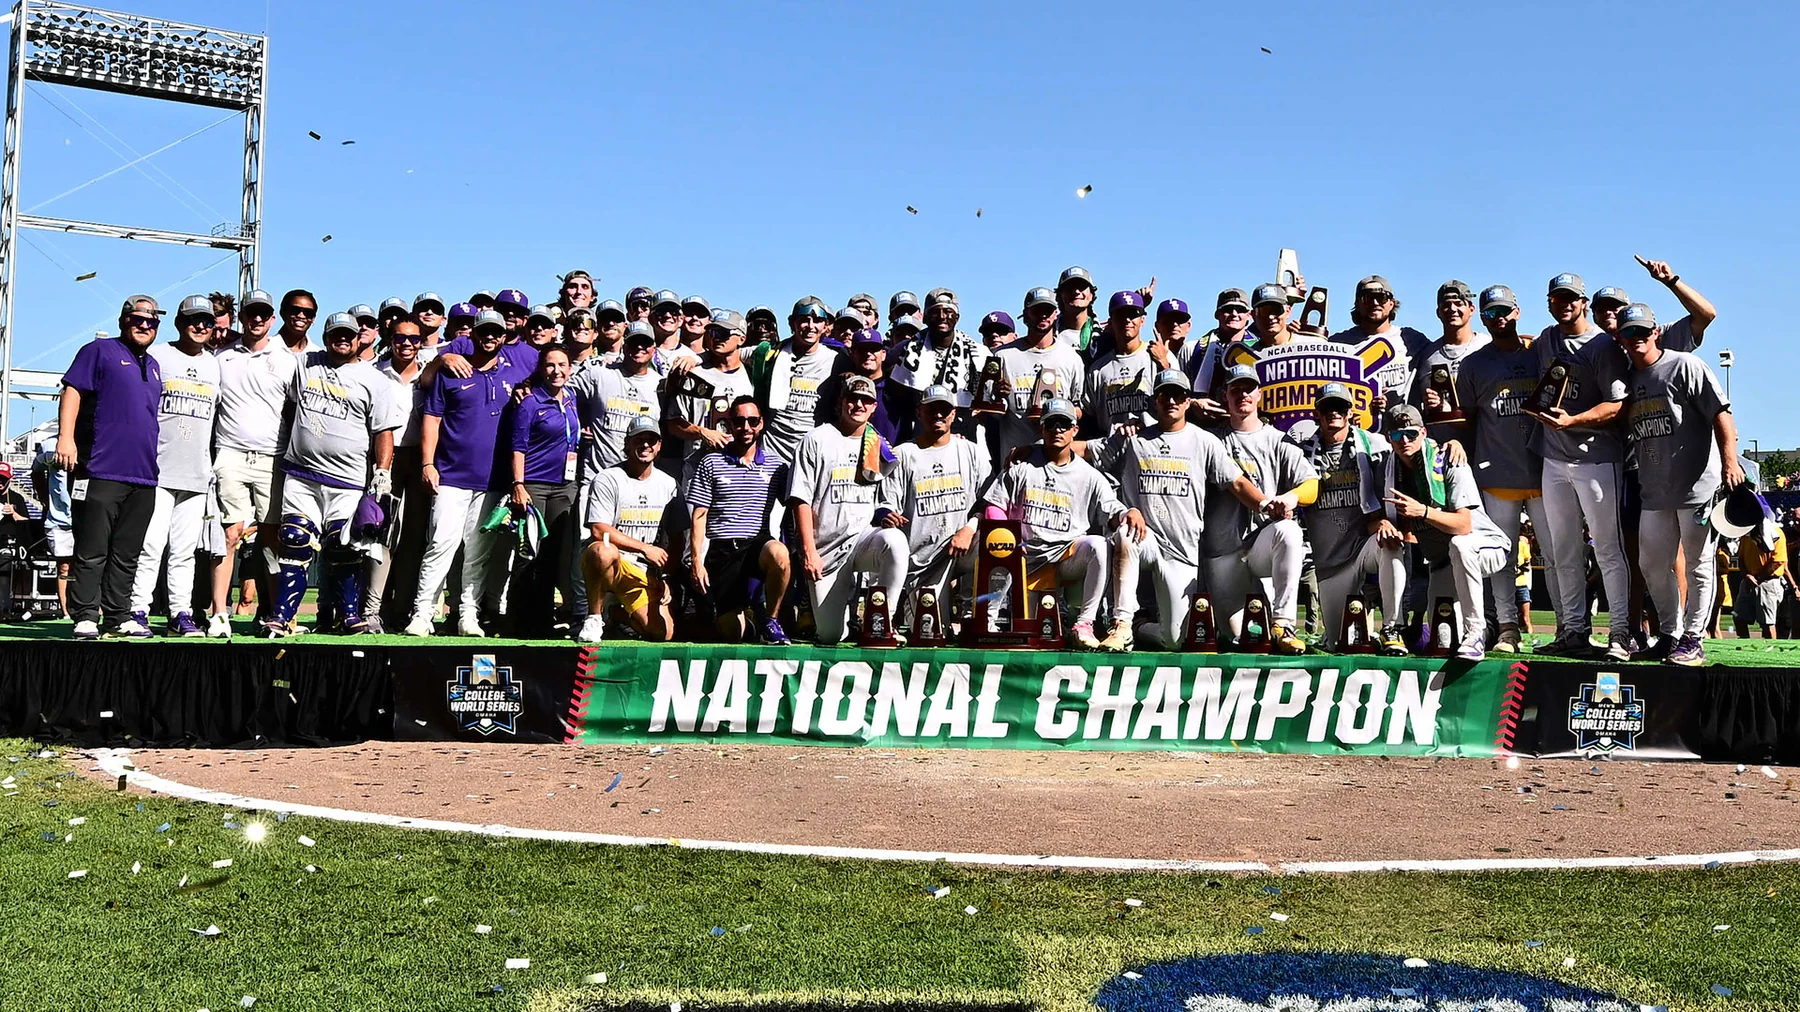
LSU illustrates the separate jobs these records perform. Its 2025 roster identifies the personnel assigned to that season, while its 2025 cumulative statistics describe recorded competition. A list of pitchers plus a list of hitters is also not automatically a count of unique players: a two-way player may be represented in both. For a headcount, match people rather than adding statistical rows.
The same discipline applies at national level. A school count describes programs, a participant count describes athletes under a reporting definition, and a statistical leaderboard describes performances meeting that table's criteria. None of those automatically measures full scholarships, professional prospects or available recruiting places. Keeping the labels attached prevents a plausible-looking total from answering the wrong question.
Why an average roster is not a roster limit
The report's 42.2 average is a historical summary across its 300 D1 baseball teams. It is not a rule permitting every future team to carry exactly 42 or 43 players. Nor does comparing that mean with a later 34-player framework prove that each school cut eight athletes. The seasons, definitions and exemptions must be aligned before making a before-and-after claim.
For a useful comparison, put the academic year, division, participant definition and source beside both figures. If any of those changes, investigate it before interpreting the difference as growth or decline. That is especially valuable for baseball: the players available for a weekend series, everyone developing inside a program, and everyone listed in an annual institutional report can be different groups.
How the 34-player roster framework works
Baseball's settlement roster limit is 34 countable players at participating Division I institutions. The NCAA's adopted roster legislation, effective July 1, 2025, sets that number for institutions within the settlement framework. This is the rule behind most recent references to a “34-man roster.” It should not be rewritten as a finding that every D1 program has exactly 34 people or that the national population equals 34 multiplied by a school directory.
Applicability comes first. The NCAA's February 2026 implementation questions distinguish participating institutions from nonparticipating institutions; the latter do not have to follow these settlement roster limits. For a particular program, establish which framework applies in the relevant academic year before comparing its website with a rule table. A conference logo, a school's public roster length and an old recruiting article are not substitutes for that information.
Designated student-athletes explain some larger rosters
The designated student-athlete provisions create another important distinction. Qualifying athletes affected by implementation of the limits can be identified by their institution and excluded from the countable limit while they retain athletics eligibility. The criteria refer to specified existing players and recruits associated with the transition into 2025–26. This is an institutional designation under defined conditions, not an automatic exemption for anyone who once played college baseball.
As a simplified illustration, a submitted roster containing 34 countable players and four qualifying exempt players would contain 38 people. The example explains why the visible headcount can exceed 34; it does not establish the status of any actual athlete. The exemption and the person are both real parts of the program even though the rules count them differently for the limit.
This matters when evaluating depth. A fan can see extra bullpen options or additional catchers on a roster without being able to identify which names are countable. A recruit can also face competition from an exempt returning player. The public list is useful for understanding personnel, but it rarely includes everything needed for a compliance calculation.
When a roster appears surprising, ask three questions in order: What season does this page represent? Is the institution participating in the settlement framework that year? Which documented exceptions apply? That sequence is more reliable than treating every name beyond number 34 as an error. It also explains why a historical national participation total cannot be “corrected” simply by imposing one new limit on every team.
Roster places and baseball scholarships are separate questions
A D1 player count is not a scholarship count. Some athletes receive athletics aid, some receive other financial assistance, and some attend without an athletics scholarship. The national participation report does not establish that every person in its baseball total receives a full ride. A roster tells you who belongs to a team; the athlete's financial-aid agreement tells you what the school has actually offered.
The settlement framework gives participating schools the opportunity to provide scholarships more broadly. Permission and budget remain different things. A program able to award aid to its roster is not thereby promising every recruit the same package, and the existence of a roster place does not tell you the family's remaining cost. The NCAA's scholarship guidance is a starting point for separating athletics aid from other types of support.
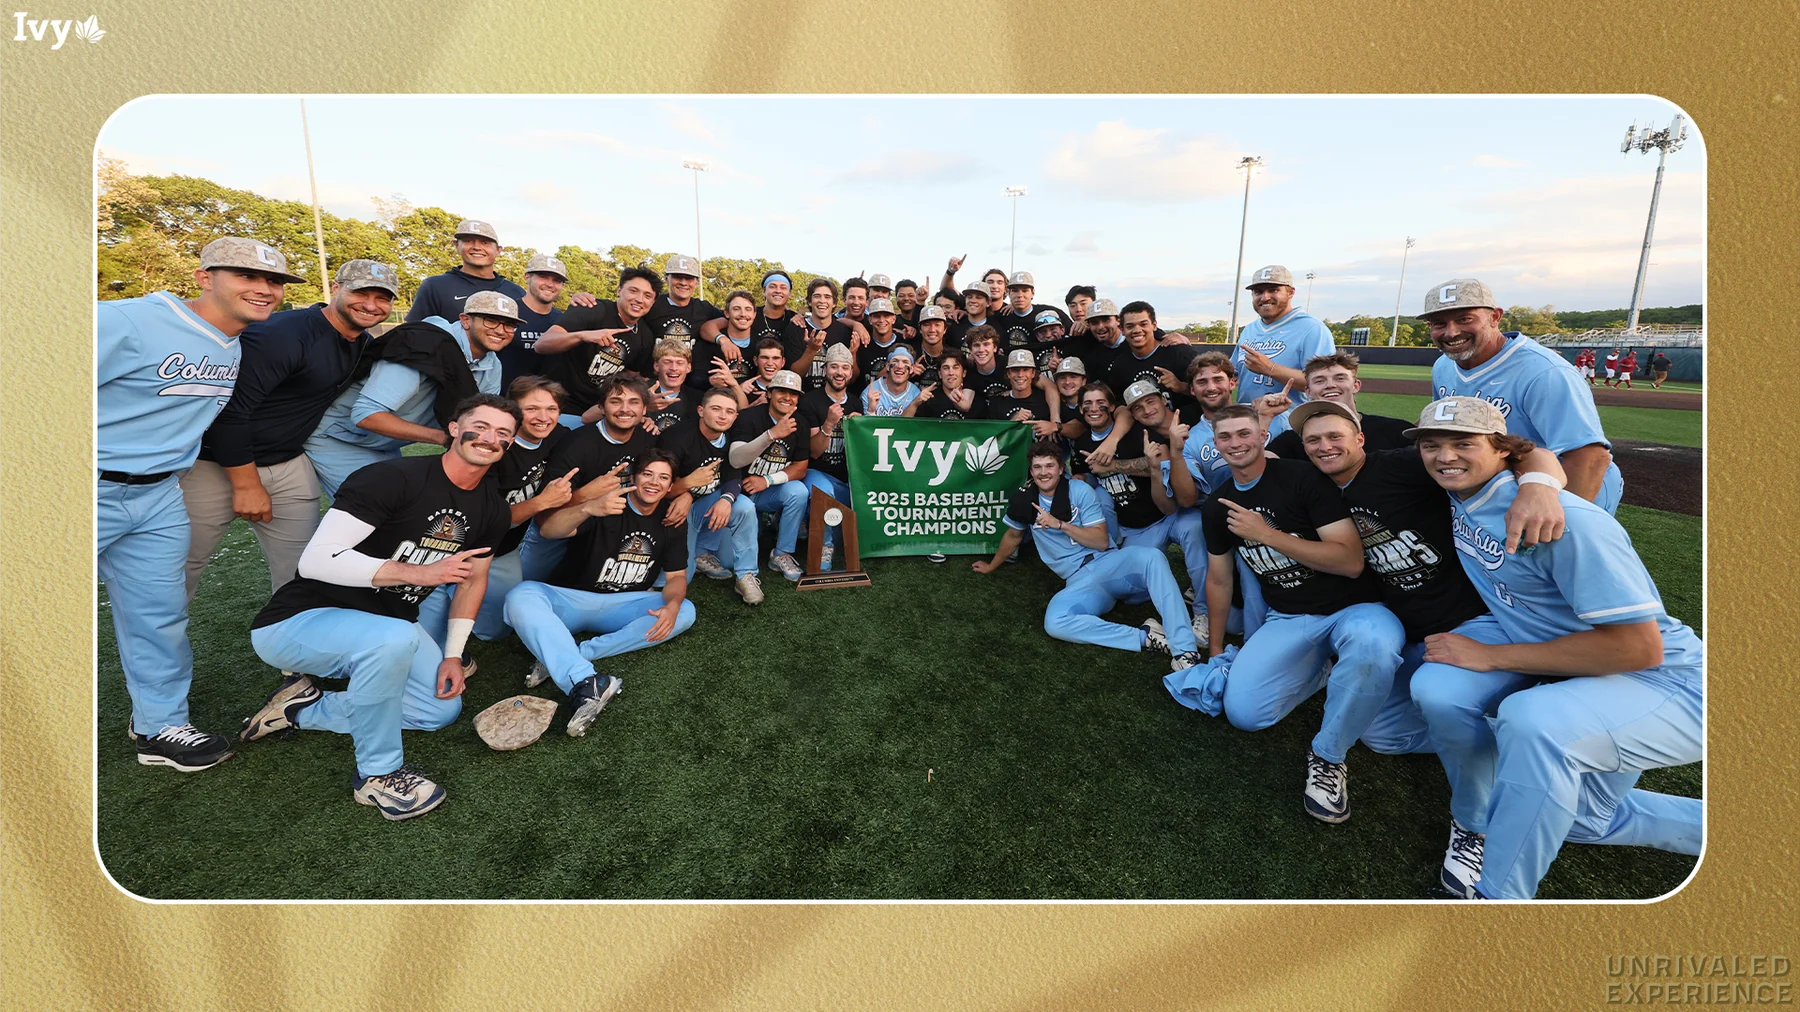
The Ivy League offers a clear baseball example. Its official prospective-athlete information states that Ivy institutions do not award athletic scholarships. Those players still compete in Division I. Columbia's 2025 Ivy tournament championship belongs to the same college baseball landscape as programs using athletics scholarships, even though the financial-aid structure differs. Counting D1 athletes only at schools that offer baseball scholarships would therefore omit part of the sport.
Older articles often describe baseball exclusively through an 11.7-scholarship equivalency limit. That figure describes the older framework and remains relevant to the nonparticipating-institution example in the NCAA's February 2026 settlement guidance. It should not be applied indiscriminately to every current D1 school. Conversely, replacing every mention of 11.7 with “34 full scholarships” creates a new error by treating capacity as an actual award.
For a family comparing offers, make two separate lists. One should describe the baseball opportunity: expected role, development plan and how the athlete fits the returning roster. The other should describe the written financial package: athletics aid, need-based aid, other awards, covered expenses and remaining cost. Ask the financial-aid office to confirm how the pieces work together. A stronger team reputation does not by itself make either list more favorable.
The same separation helps fans interpret roster news. A player staying on a team and a player receiving renewed aid are related stories, but they are not interchangeable facts. Read what the school actually announced before converting either development into a claim about roster size or scholarship distribution.
Read a college baseball roster alongside its season statistics
To understand one team's size, start with its official roster and select the season explicitly. Record the names and positions, then open the cumulative statistics for that same season. LSU's baseball statistics archive, for example, separates annual statistics from individual box scores. That lets you move from the list of players to how the team actually used them.
Follow pitchers and position players separately
For pitchers, look at appearances, starts and innings pitched together. A starter may enter fewer games than a frequently used reliever while throwing considerably more innings. For position players, compare games, starts and batting opportunities. A late-game defensive replacement or pinch runner can contribute without receiving the plate appearances of an everyday hitter. Ranking everyone solely by games played can therefore hide rather than clarify their role.
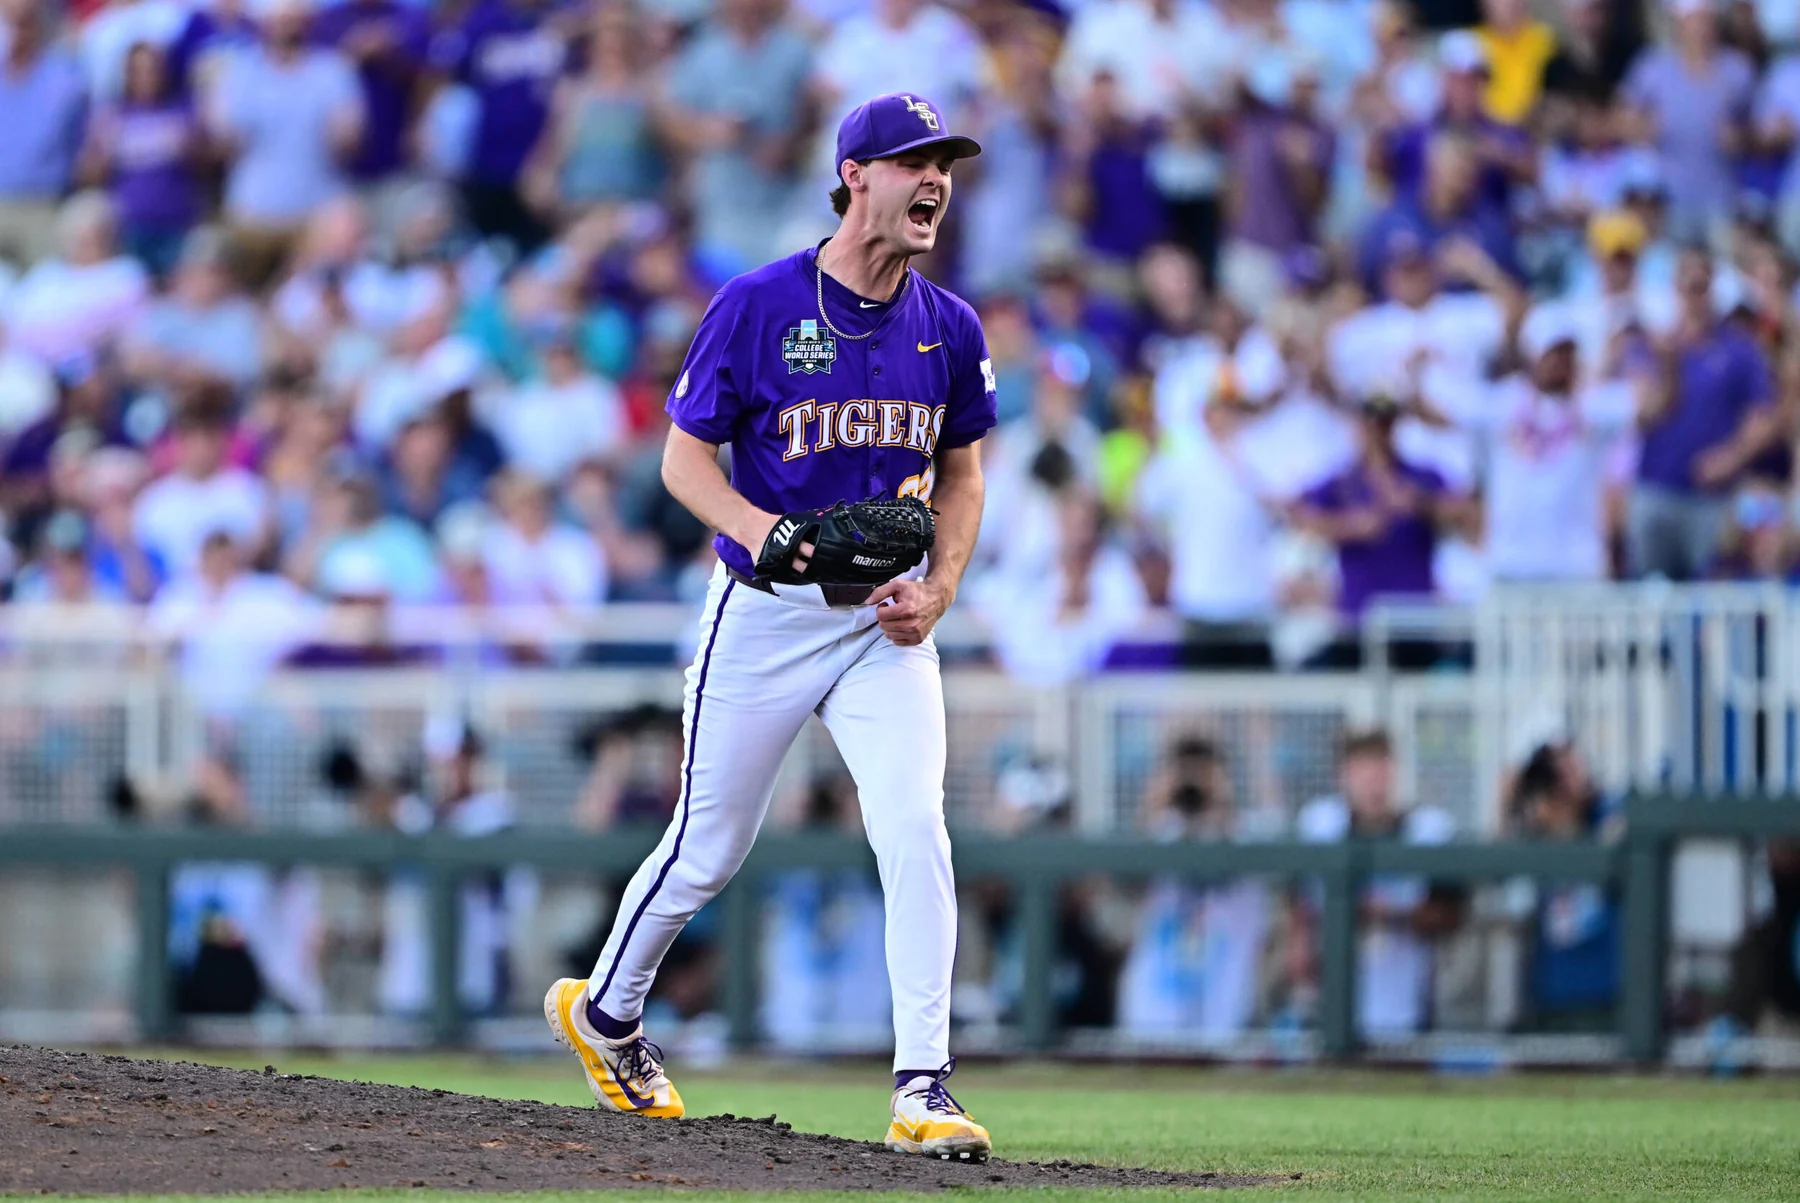
Kade Anderson's complete-game shutout in Game 1 of the 2025 College World Series finals is a concrete example: one pitcher supplied all nine innings of LSU's 1–0 win over Coastal Carolina. The number of pitchers who appeared that night tells you almost nothing about the size of LSU's full pitching staff. A single box score describes the choices and circumstances of one game.
A better depth review samples a weekend series and a midweek game, then checks the season totals. Watch whether the same arms cover the highest-pressure innings, whether a hitter starts against both left- and right-handed pitching, and which reserves enter close games. These are observational questions for the records to answer, not assumptions about how every program operates.
Check the roster date before comparing schools
School websites frequently move their default roster to the next season before all readers have finished looking back at the previous one. A current page and an archived page may therefore show different groups while both are correct. Use the season selector or a season-specific URL, and save the date of your comparison. For a headcount, count each person once even if he has multiple position labels.
Our college baseball team directory helps identify programs to follow, but use their official personnel and statistics pages for a detailed roster review. If a name appears on one page and not another, check the update date and team announcement before drawing a conclusion. The absence of innings or at-bats alone does not prove that someone left the program, lost aid, was injured or was redshirted. A careful roster comparison answers what the public records show and leaves private status questions to confirmed information.
What the national count means for a prospective player
The national total shows the scale of Division I baseball, but it does not mean that the same number of places opens every summer. Returning players occupy much of the population. Departures, transfers, new recruits and changes in team sponsorship alter individual programs in different ways. Dividing the total by an assumed number of college seasons does not produce a verified list of freshman vacancies.
The NCAA's 2024–25 comparison of high school and college participation estimates that 2.7 percent of high school baseball participants correspond to the Division I population. Its methodology compares population totals and assumes broadly similar turnover. It does not follow every member of one high school graduating class through college, and it is not a personalized probability for an individual recruit.
A player already being evaluated by several programs is in a different situation from someone who has never contacted a coach. Position, competition level, development, academic preparation and the needs of particular teams all affect the practical search. The national percentage is useful context for keeping a broad college list. It is much less useful as a verdict on one player's future.
Ask a program about your role, not just its headcount
After reviewing a season's roster and statistics, turn observations into specific questions. A catcher might ask how the staff develops receiving and throwing while managing playing time behind an established starter. A pitcher might ask how the program evaluates a starting role against a relief role, and how it builds workload. An infielder might ask which positions the staff wants him to learn. These questions produce more information than asking whether a roster is “big.”
- Which returning players and incoming recruits are expected at my position?
- What baseball development goals would the staff set for my first year?
- What does the proposed roster place mean for participation, and what remains conditional?
- Which financial support is confirmed in writing, and what expenses remain?
- Who can confirm my academic and athletics eligibility for the intended entry year?
Use the NCAA recruiting resources for the applicable recruiting framework, then direct program-specific questions to the school's staff. Do not assume that a player listed as a senior automatically creates a vacancy or that a public verbal commitment settles a future roster. Eligibility and enrollment details need confirmation.
Following a program through its college baseball schedule can make those conversations more concrete. Compare how the team uses players across a series, a midweek game and the postseason. The useful starting answer remains 12,649 reported D1 participants in 2024–25. The useful next step is to understand the particular program, season and role behind the opportunity you are considering.
Join the conversation
Share a question or a thought about college baseball. Comments are reviewed before they appear. Keep it friendly and on topic.
No comments yet. Start the conversation.
Sign in with Google to leave a comment. Your email address is not displayed.