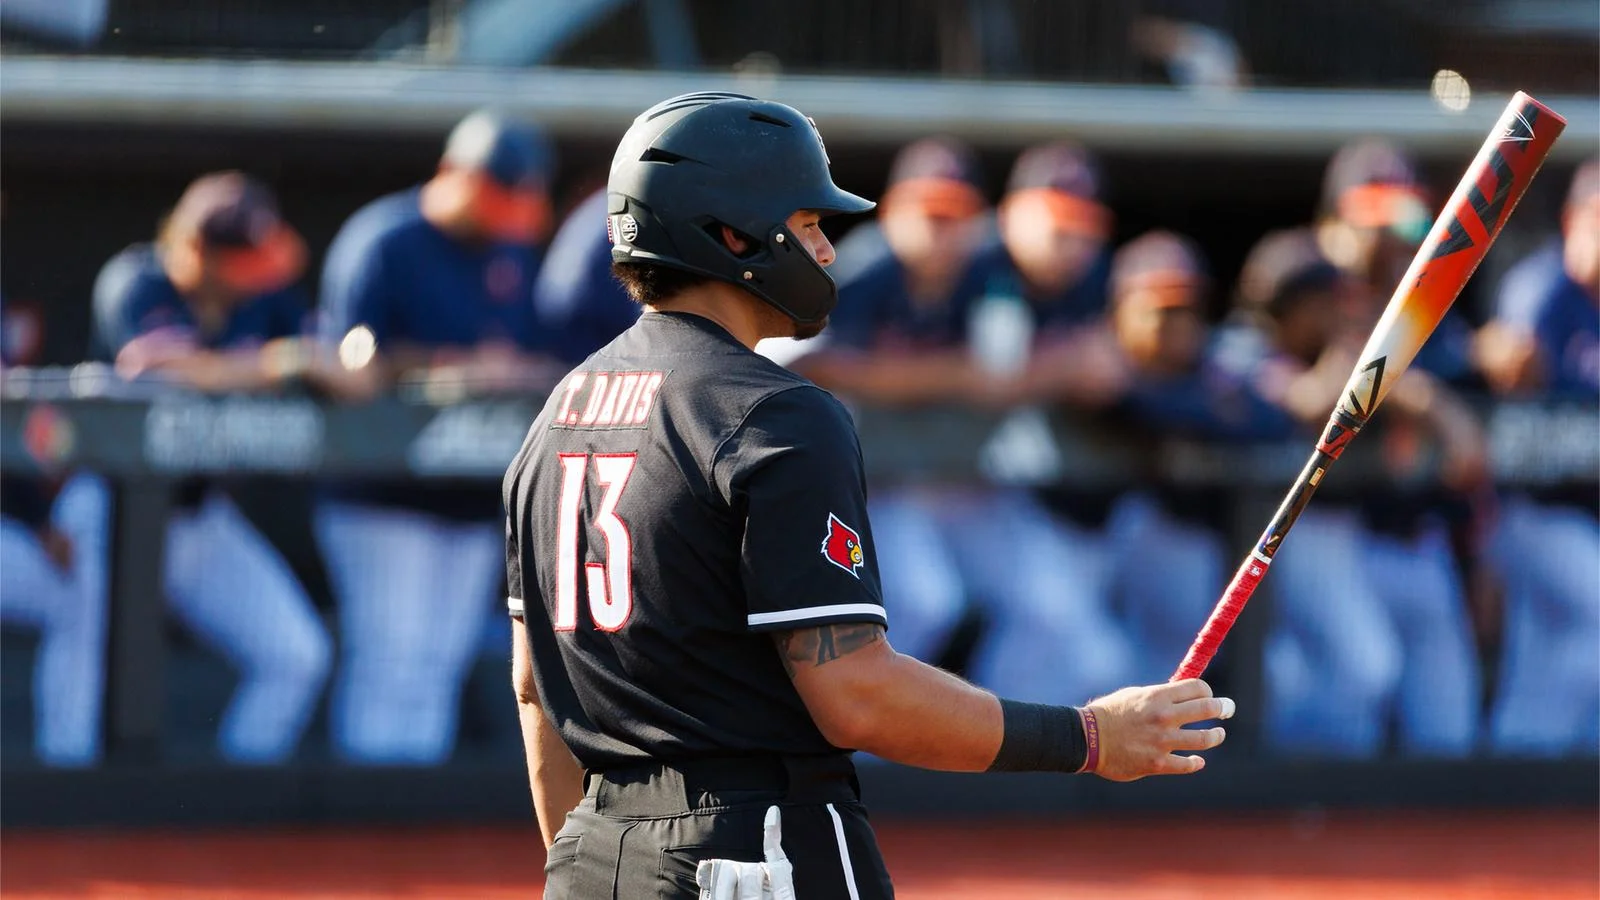
Louisville's Tague Davis finished the 2026 Division I baseball season with 34 home runs, ahead of Daniel Jackson of Georgia and Hunter Ray of FDU, who shared second place with 32. Oklahoma State's Kollin Ritchie finished fourth with 31. Those are completed-season totals, including postseason games, rather than a projection from an April hot streak.
The four leaders also show why the home run race deserves more than a single descending column. They reached those totals across different numbers of games, and a team advancing further in the postseason could keep creating opportunities after another player's season had ended. Start with the final count, then consider how each hitter produced it.
Establish the final Division I home run leaders
The table below covers the top four players in the final national home run table through June 22, 2026, published June 23. It preserves the tie at second. Jackson and Ray both hit 32; the order in which a website displays their names does not break that tie or put one in third place.
| Final rank | Player | School | Games played | Home runs |
|---|---|---|---|---|
| 1 | Tague Davis | Louisville | 57 | 34 |
| T2 | Daniel Jackson | Georgia | 67 | 32 |
| T2 | Hunter Ray | FDU | 55 | 32 |
| 4 | Kollin Ritchie | Oklahoma State | 60 | 31 |
School reports independently support the totals. Louisville's October recognition of Davis confirms his 34 homers and the national lead. FDU's season review of Ray records 32 homers in all 55 of his team's games. Oklahoma State's July superlatives explicitly place Ritchie's 31 fourth nationally.
The scope matters when comparing a search result with this table. These are individual Division I totals from the spring 2026 college season. A Division II leaderboard, a summer collegiate league, conference-only statistics and a player's career home run count answer different questions. An athlete's 2027 roster page can also include a career summary without changing the year in which these home runs were hit.
For the same reason, read an old awards release in the context of its publication date. A hitter can finish his team's schedule while other contenders are still playing. His personal total may already be final, but his national rank can still change. A June article calling someone second or third should not automatically override a later season review that incorporates the rest of the NCAA tournament.
Davis won this particular counting race by two home runs. That is a clear result, even though it does not settle every argument about the country's best hitter. A home run leaderboard counts a specific outcome. It does not adjust for opposing pitching, defensive position, ballpark dimensions, walks or how many runners were on base. Those questions add meaning to the result; they do not erase it.
Team power is a separate category as well. A lineup can lead the nation by collecting home runs from many hitters without supplying the individual champion. Conversely, one exceptional slugger can top the individual list even if his club does not play in Omaha. Keeping the player and team columns separate prevents a compelling team headline from being mistaken for the answer to the individual race.
Compare totals with games and opportunities
The gap between Jackson's 67 games and Ray's 55 is large enough to change the interpretation of their shared total. Each hit 32 home runs, but Ray generated that number across 12 fewer appearances. That observation describes frequency; it does not prove what either player would have done in the other's schedule.

Home runs per game changes the question
Dividing the verified final totals by games played gives Davis 0.596 home runs per game, Ray 0.582, Ritchie 0.517 and Jackson 0.478, rounded to three decimals. This is a comparison of the four players above, not a separate claim about who qualified for every national rate leaderboard.
Davis led this group in both total home runs and that simple rate. Ray's rate was close despite the two-homer gap in the counting standings. Jackson's longer season helped him accumulate more chances, but a rate calculation should not turn his extra games into a penalty: continuing to contribute while a team advances is valuable in its own right.
Games are an accessible denominator, although they are imperfect. A player can enter late, leave early or receive fewer trips to the plate because of his spot in the batting order. The number of opposing outs recorded also affects how many turns a lineup gets. Therefore, games played provide a first adjustment for opportunity, not a complete measure of how often a hitter homered when he actually batted.
A projected total based on equal games would introduce another assumption: that the player's rate would remain unchanged against the additional opponents. That might make an interesting hypothetical, but it is unnecessary for describing the actual 2026 race. Keep the observed rate and the observed count together instead of converting a hypothetical into an achievement.
At-bats and plate appearances tell another part of the story
The official overall school statistics record 231 at-bats for Davis, 235 for Ray and 264 for Jackson. Those figures translate to approximately one home run per 6.79, 7.34 and 8.25 at-bats, respectively. The calculation is at-bats divided by home runs; a smaller result means more frequent home runs within that denominator.
An at-bat is narrower than a completed turn at the plate. The NCAA's official scoring guidance excludes walks, hit-by-pitches and sacrifices from official at-bats. Plate appearances include outcomes that therefore disappear from an at-bat comparison. A batter who accepts a walk has helped his offense without recording either an at-bat or a home run.
Ray drew 48 walks, compared with Jackson's 44 and Davis's 36. Those totals offer useful additional context, but they do not tell us exactly why pitchers missed the strike zone. They cannot, by themselves, prove that one hitter was pitched around more often. Nor should an analyst add only walks to at-bats and label the result complete plate appearances while ignoring hit-by-pitches and other outcomes.
For a useful fan comparison, write the denominator beside every rate. Home runs per game, home runs per at-bat and home runs per plate appearance are related measurements with different meanings. None of these raw figures adjusts for ballparks or opponent quality, so use them to sharpen the question rather than pretending they answer every version of it.
Put the leading power seasons in their team context
Georgia provides the clearest example of an individual contender inside a deep power lineup. The Bulldogs finished 53-14 and tied for third at the College World Series. Their season review records a national-leading 179 team home runs. Jackson supplied 32 of them, leaving 147 supplied by his teammates.
That distribution matters to how a fan experiences a series. A pitching staff cannot prepare only for the player near the top of the national individual list. The other eight batting-order positions keep coming around, and damage elsewhere can force a coach to change pitchers before the headline hitter returns. This is a lineup interpretation, not a claim that the team total proves any specific pitch sequence Jackson received.
Oklahoma State offers a similar lesson with a different result. The Cowboys hit 150 home runs, second nationally, and seven players reached double figures, according to their July season review. Ritchie supplied 31, about 21 percent of the team total. His season was exceptional, while the combined contribution around him was much larger than his own count.
For a series preview, those team totals suggest a useful follow-up question: how much power remains when the most dangerous hitter does not get a pitch he can drive? They do not answer whether every pitcher or ballpark was equally difficult. A team total describes what happened across the schedule; evaluating the next matchup still requires looking at the actual opposing staff.
The postseason changes the setting as well as the opportunity count. A hitter on a team still playing can add to his line, while an eliminated contender cannot respond. That does not make a conference tournament home run worth less than one in a regional. Both belong in the full-season column. It means an analyst should distinguish the completed personal season from a national race that is still open.
Extra-base production is broader than the home run column
Davis and Jackson illustrate how different power measures can disagree without either being wrong. Davis finished with 196 total bases and an .848 slugging percentage. Jackson finished with 212 total bases and an .803 slugging percentage. The Georgia cumulative statistics record Jackson's larger total across 264 at-bats; Davis accumulated his total across 231.
Total bases assign one for a single, two for a double, three for a triple and four for a home run. They count bases produced by hits, not every base a player reaches during the game. A walk or a stolen base can improve the offense without adding to this statistic. Slugging percentage then divides total bases by at-bats, allowing a player with fewer total bases to post the higher rate.
Davis's 34 homers supplied 136 of his 196 total bases. Jackson's 32 supplied 128 of his 212. Jackson also collected 14 doubles and one triple, alongside his singles; Davis had 10 doubles and one triple. The comparison explains why winning the home run count does not automatically mean winning the total-base count.
RBI adds another question: how many runs did the hitter drive in? Davis finished with 98 and Jackson with 87, but RBI also depends on who reaches base ahead of a batter and the situations in which he hits. For evaluating power, pair that production with the hit distribution and opportunity count. A single headline statistic can be correct while still leaving much of an outstanding offensive season unexplained.
How the 2026 totals fit beside the historical standard
Pete Incaviglia's 48 home runs for Oklahoma State in 1985 remain the benchmark cited in Oklahoma State's 2026 season review. The NCAA Division I record book lists those 48 across 75 games. Davis's winning 2026 total of 34 finished 14 short of that mark.
That gap is worth stating plainly. Winning a national season title is an accomplishment on its own; it does not need to be described as nearly breaking the all-time record. The comparison becomes more informative when the games played appear alongside the totals. Incaviglia's 75 games were 18 more than Davis's 57.
On a simple per-game basis, Incaviglia's season works out to 0.640 home runs, compared with Davis's 0.596. That narrows the visual gap between 48 and 34, while still leaving Incaviglia ahead on both measures. It does not establish what Davis would have hit across 75 games or what Incaviglia would have hit against the 2026 schedule.
Historical comparisons become less reliable when a rate is treated as a complete adjustment for every difference between seasons. It accounts for the number of games in the denominator. It does not account for the opponents, playing conditions or distribution of plate appearances inside those games. A defensible comparison can acknowledge those limits without assigning invented weights to them.
Ritchie also shows the value of school context. Oklahoma State identifies his 31 homers as the second-highest season total in program history, behind Incaviglia. Finishing fourth nationally and second on a school's historical list describe different achievements. Both can be true, and the school comparison helps explain why a season below the national lead still mattered so much to that program.
Finally, keep single-season and career records apart. A career total accumulates across multiple college seasons; the 2026 table counts only this one spring. Searching for the most prolific college home run hitter ever can return either category. Read the heading before comparing a number with 34, especially when a player's biography places his season and career milestones in the same paragraph.
Follow a power leaderboard without mixing seasons
As of October 20, 2026, the figures in this guide describe the completed 2026 spring season. They are a reference for that race, not a rolling forecast for 2027. When the next season starts, keep its developing totals in a separate comparison instead of replacing the year on an old list.
The NCAA Division I home run statistics page is a useful official starting point for the active season. Check its season and update date, then use the relevant school's cumulative statistics for the player's complete line. On school pages, make sure the overall tab is selected if the national comparison covers the whole season; conference-only figures omit nonconference games.
A publication date and a games-through date are different pieces of information. A table posted on Tuesday might include Monday's games, while a story posted later that afternoon might refer to a total established several days earlier. The games-through date explains the actual statistical cutoff. It is especially useful during a busy weekend with multiple games and rapidly changing totals.
A useful checklist for the next home run chase
- Confirm the year, Division I scope and individual home run category before comparing names.
- Keep the cutoff date next to the total, especially if the contenders' teams have played different numbers of games.
- Use the same denominator for a rate comparison and state whether it is games, at-bats or plate appearances.
- Check the school box score for a newly reported home run and allow for the cumulative table's next update.
- Preserve exact ties in counting statistics rather than assuming the website's name order breaks them.
Use the college baseball scores page to see which games have finished and today's schedule to find the next opportunities to watch. A scheduled matchup is an opportunity on the calendar, not an appearance already earned by a player. A rainout, a lineup decision or a shortened outing can change that connection.
For watching a contender, the next useful question is specific: which pitcher will he face, and where does the power threat sit within the rest of the lineup? The leaderboard helps identify an interesting hitter. The game supplies the context that a cumulative number cannot capture, from how he handles a breaking ball with two strikes to whether he accepts a walk when there is little to hit.
Keep that observation separate from the recorded result. One quiet series does not undo a full season of production, and one multi-homer game does not establish a new long-term rate. The final 2026 count answers who finished first. Following the underlying opportunities and the surrounding offense explains how those totals came to be.
Join the conversation
Share a question or a thought about college baseball. Comments are reviewed before they appear. Keep it friendly and on topic.
No comments yet. Start the conversation.
Sign in with Google to leave a comment. Your email address is not displayed.